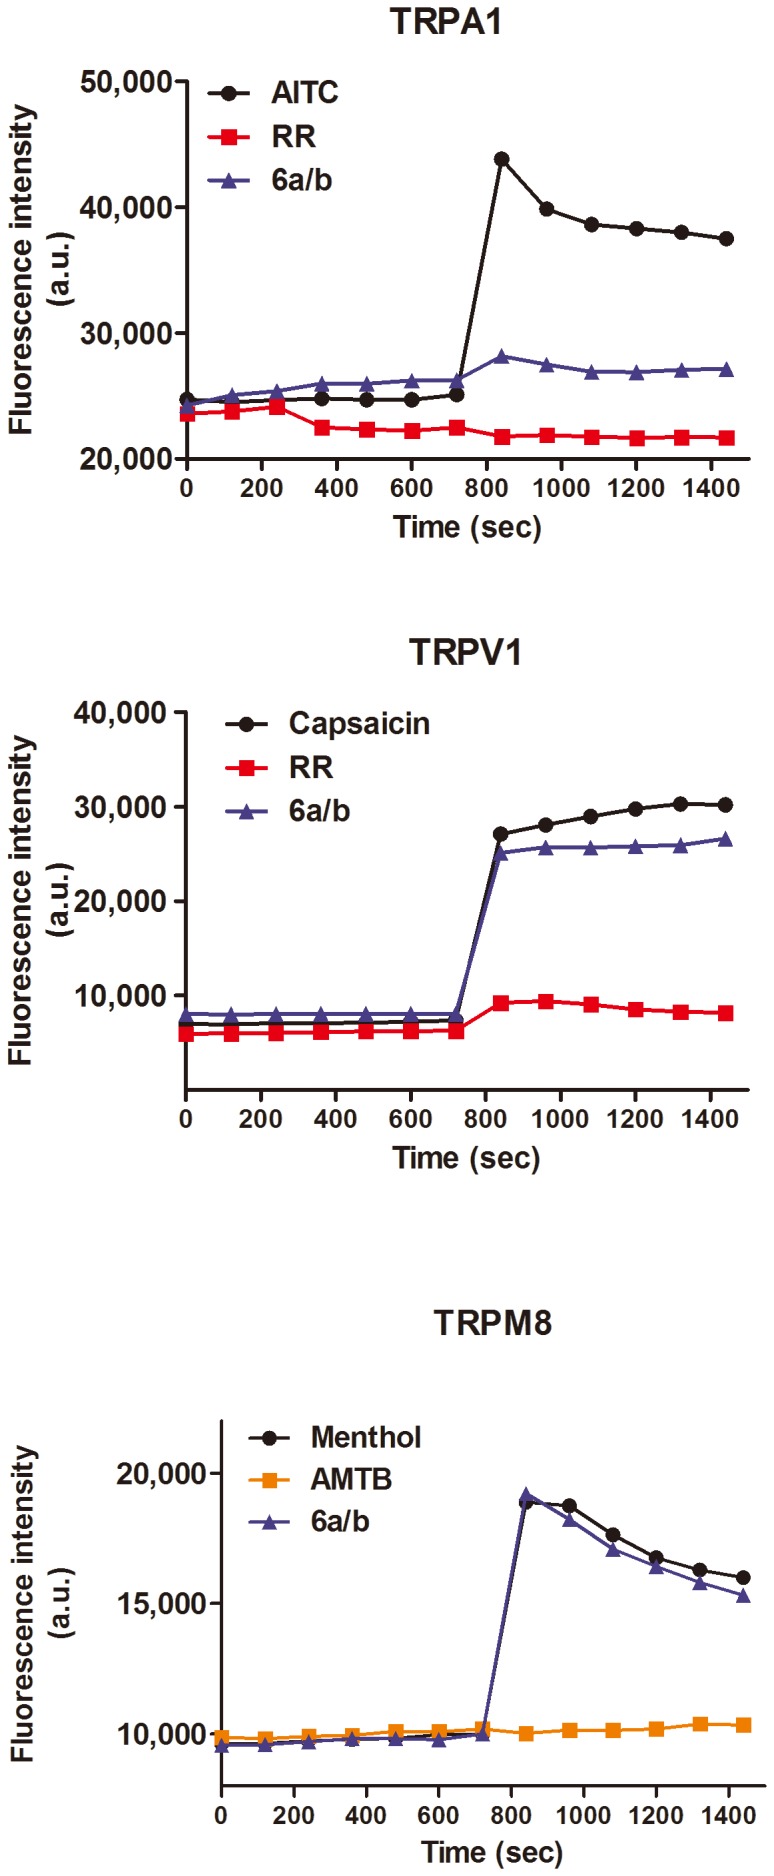
Figure 6. Functional expression of the TRP channels in the cell lines.

Fluorescence time course for cells treated with TRP antagonists (squares) or agonist (circle). TRP-mediated Ca2+ influx was observed upon addition of agonist in the seven cycle, while the addition of the antagonist (squares) antagonized this response. The effect of the compound 6a/b at 50 µM is shown (triangles). TRPA1 was activated with 100 µM AITC, TRPV1 was activated by 10 µM capsaicin and TRPM8 was activated with 100 µM menthol. Ruthenium red (RR) was at 10 µM, and AMTB was used at 100 µM.
