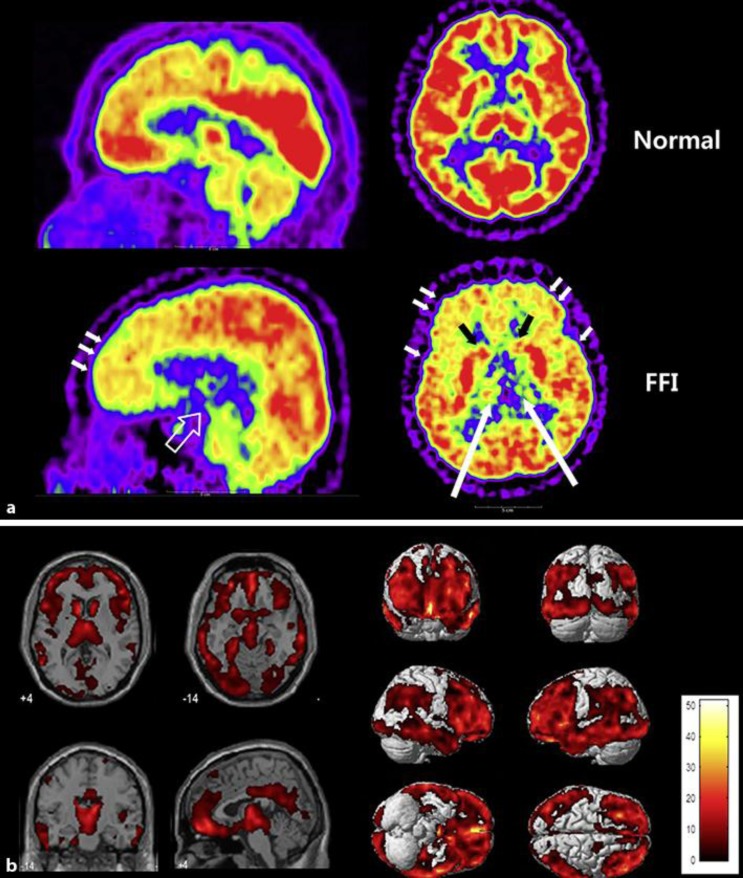
Fig. 2.
SPM analysis of the patient's 18F-FDG brain PET. a The proband's 18F-FDG brain PET scan shows hypometabolism of the bilateral thalami (long arrows), caudate nuclei (black arrows), midbrain (empty arrow), and frontal and temporal cortices (short arrows). b SPM analysis of the proband. Prominent hypometabolism was observed in the bilateral caudate nuclei, thalami, hypothalamus, frontotemporal cortices, posterior cingulate gyri, precuneus and midbrain. Colored areas indicate significantly decreased metabolism compared with 7 healthy male controls (FDR-corrected p < 0.05).

