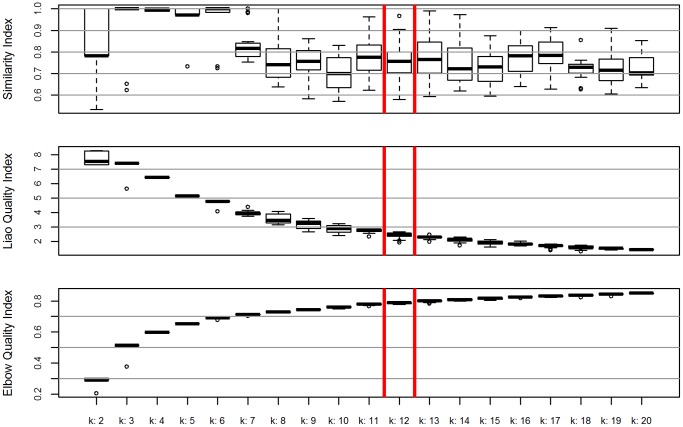
Figure 1. Boxplot from three indexes, Quality of Elbow and Similarity and Quality of Liao, built to determine the best decision criteria for groups, in an analysis of k-means clustering in the ACG.
The axis "x" represents the k group level and the axis “y" the value of each index, the first and last values are expressed from 0–1, with 1 being the perfect fit. The red box highlights the group with best fit.

