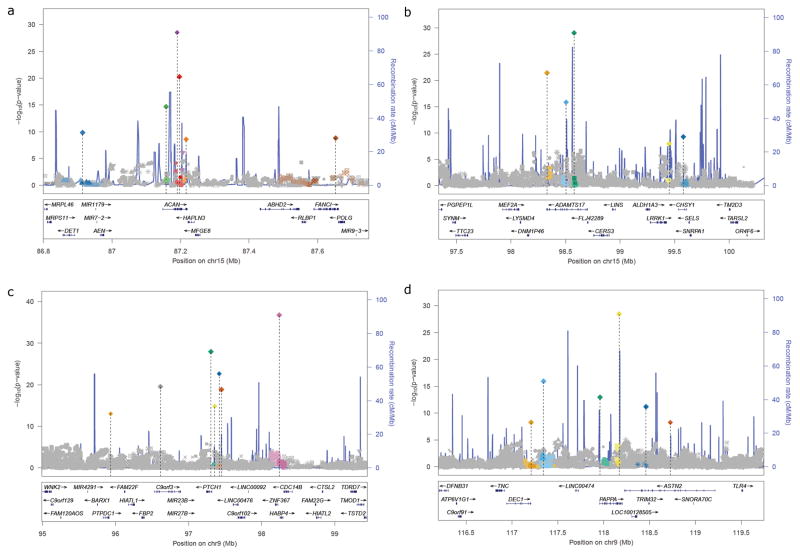
Figure 1. Regional association plots for loci with multiple association signals.
Panels a to d highlight examples of multiple signals after approximate conditional joint multiple-SNP analysis GCTA-COJO analysis. SNPs are shaded and shaped based on the index SNP with which they are in strongest LD (r2>0.4). Panels a–c show the majority of signals clustering in and around a single gene (ACAN, ADAMTS17, PTCH1, respectively) whereas panel d shows the multiple signals clustering through proximity.

