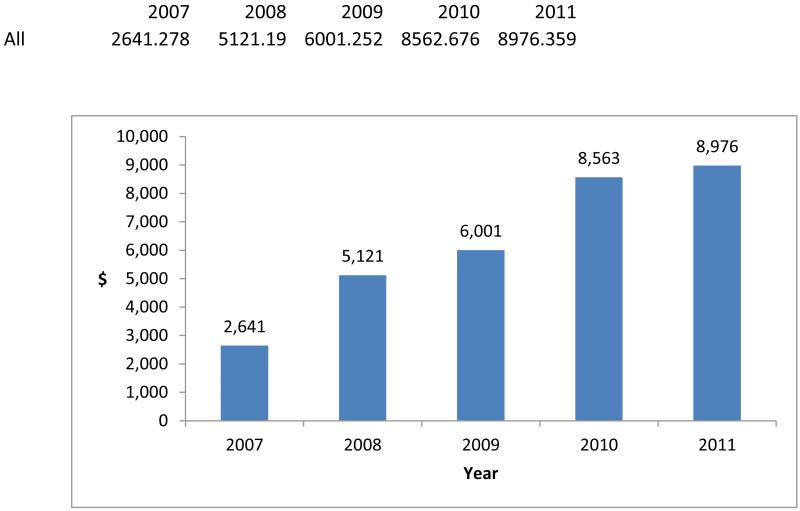
Exhibit 2 (figure). Annual Specialty Pharmacy Spending Per Elderly Medicare Specialty Drug User, 2007–11.
Source/Notes: SOURCE Authors’ analysis of pharmacy claims from a 20 percent sample of Medicare beneficiaries ages sixty-five and older. NOTES Specialty drugs are defined in the text. The sample includes elderly beneficiaries who had a specialty drug claim and who were enrolled in stand-alone prescription drug plans or in Medicare Advantage plans that had prescription drug coverage, whether or not they received a low-income subsidy. All amounts are reported in nominal dollars (that is, not adjusted for inflation).

