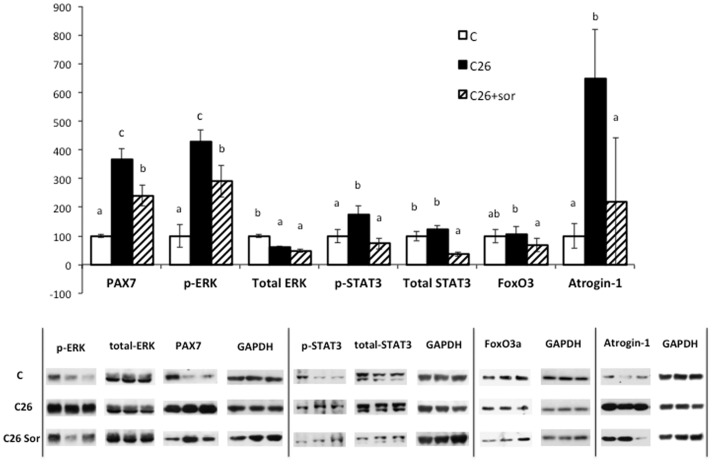
Figure 6. Intracellular signals of skeletal muscle (gastrocnemius) in sorafenib-treated mice bearing the C26 adenocarcinoma.
Results are mean ± S.E.M. C: animals without tumour; C26: C26 carcinoma-bearing mice; C26+sor: C26 adenocarcinoma-bearing mice treated with sorafenib. Values that are significantly different of the results by one-way analysis of variance (ANOVA), statistically significant difference by post hoc Duncan test. Different letters in superscript indicate significant differences between groups.

