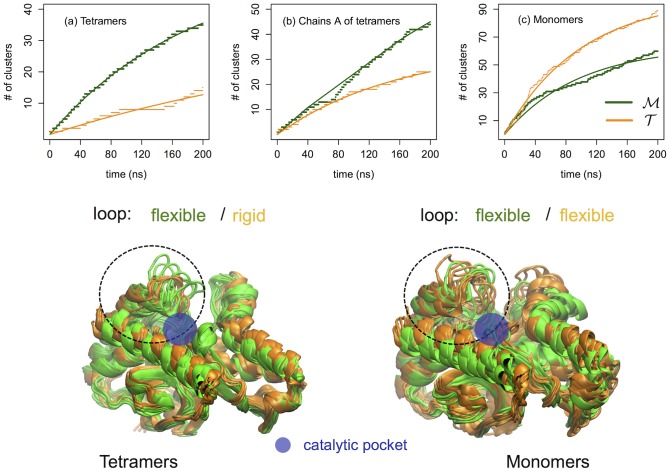
Figure 3. Conformational substates.
Upper panel: Dotted lines correspond to the number of clusters at ambient temperature versus the simulation time for the (a) two  and
and  tetramers, (b) chains A of the
  and
and  tetramers and (c)
  and
and  isolated monomers. Straight lines correspond to an exponential evolution fit of the form
  . Lower panel: Thermophilic protein is in orange and mesophilic in green color. (Left) Cluster leaders for chain A of the tetramers' clustering and (right) cluster leaders of the monomers' clustering. Notice the anchoring of the loop at the active site of tetrameric
  on the left with respect to the flexible loop of its isolated monomer on the right.

