
Figure 5.
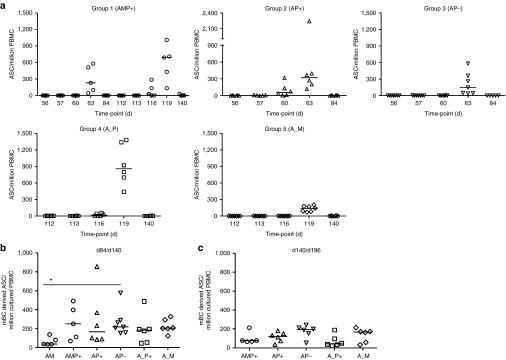
B cell responses of mixed-modality AMA1 immunization regimens. (a) AMA1-specific antibody-secreting cell (ASC) responses were assessed in each group by ex vivo ELISPOT using 3D7 + FVO AMA1 protein and fresh peripheral blood mononuclear cell (PBMC) from selected time-points post-booster vaccinations (including day of vaccination, and then 1, 4, 7, and 28 days thereafter). Individual and median responses are shown for each group, (note Group 1 received a booster immunization on both d56 and d112). Responses are reported as AMA1-specific ASC / million PBMC used in the assay. Intergroup comparisons, and AMA1-specific ASC reported as % total IgG ASC are shown in Supplementary Figure S6. (b) AMA1-specific memory B cell (mBC) responses were assessed in each group by ELISPOT assay using 3D7 + FVO AMA1 protein. Frozen PBMC were thawed and underwent a 6-day polyclonal restimulation during which ASC are derived from mBC, before testing in the assay. Responses are shown over time in Supplementary Figure S7. Here individual and median responses are reported four weeks after all booster vaccinations: day 84 following AM, AP+, and AP− immunization, and day 140 following AMP+, A_P+, and A_M immunization. (c) As for b, except the late time-point 12 weeks postfinal immunization is reported (d140/d196). *P < 0.05, Kruskal–Wallis test with Dunn's correction for multiple comparisons.