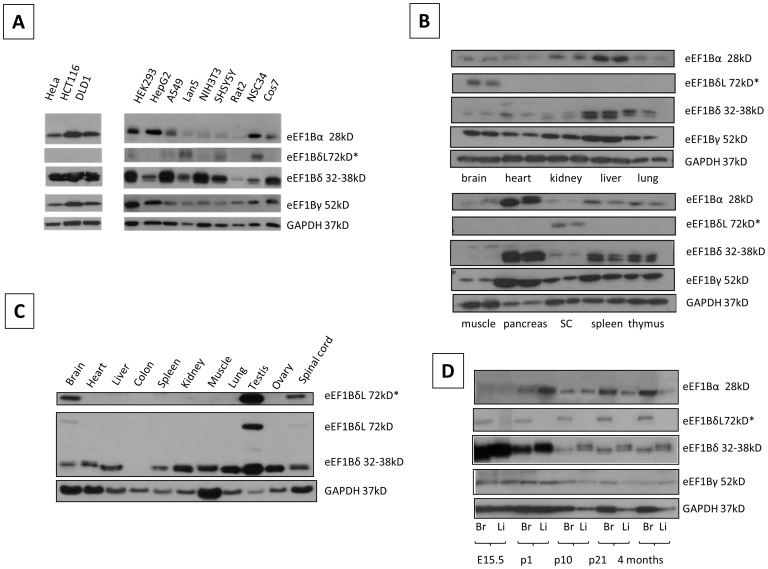
Figure 1. Expression analysis of eEF1B subunits in cell lines and tissues.
Panel A: Immunoblot of eEF1Bα, eEF1Bδ and eEF1Bγ protein expression in cell lines. GAPDH was used as a loading control. Panel B: Immunoblot of eEF1B subunits in 24-day old mice. Each tissue is shown twice, the left hand sample is from a wild type mouse and the right hand sample from a wasted homozygous mouse. SC = spinal cord. The second row shows a longer exposure of the eEF1Bδ blot, revealing the expression of the longer isoform. GAPDH was used as a loading control. Panel C: Immunoblot of eEF1Bδ in an extended panel of mouse tissues showing brain and testis-expression of the longer isoform (top panel shows a longer exposure). GAPDH was used as a loading control. Panel D: Immunoblot of eEF1B subunits expression in brain (Br) and liver (Li) throughout late embryonic and postnatal mouse development. GAPDH was used as a loading control.

