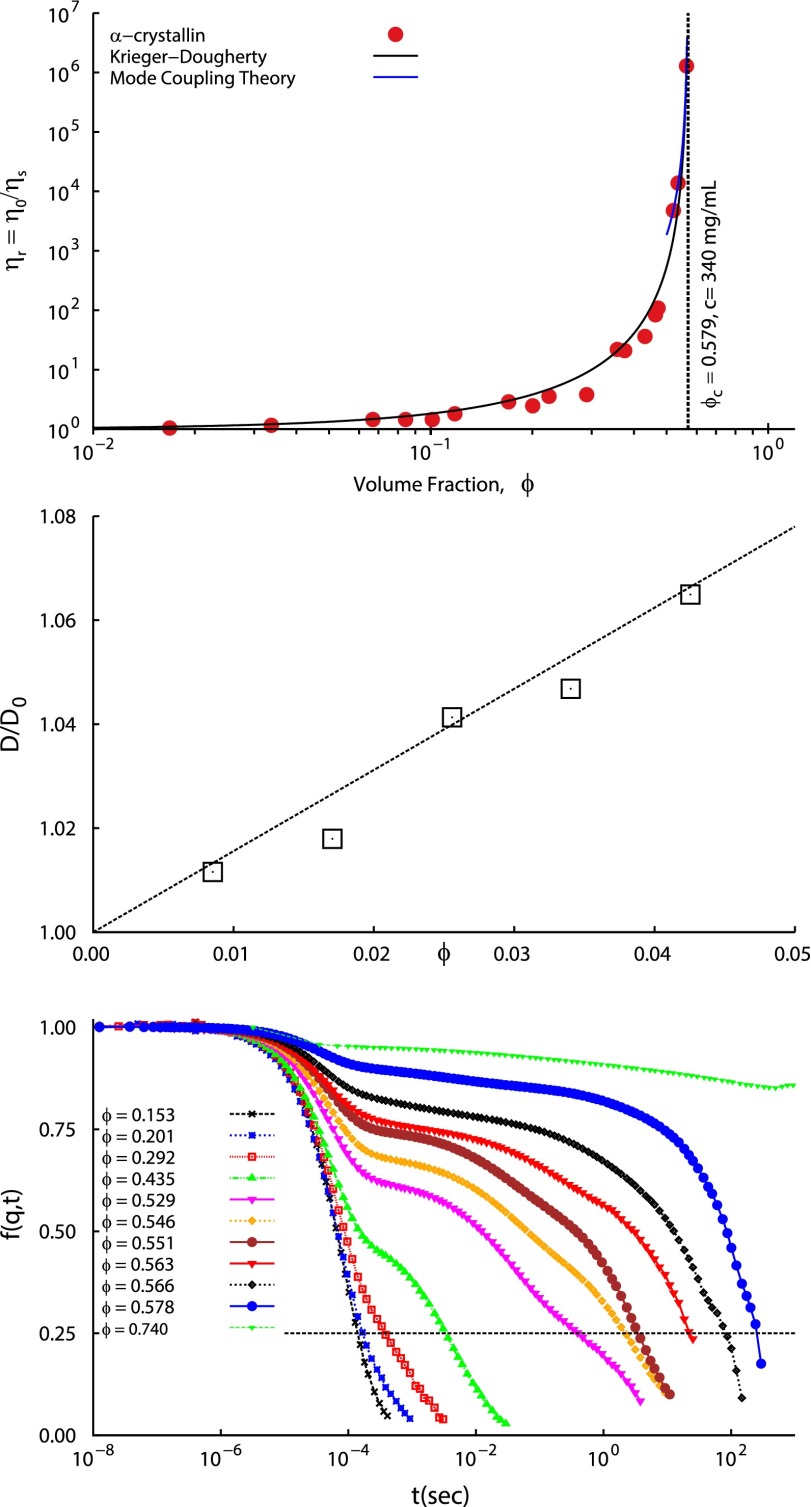
Fig. 2.
(Top) α-Crystallin solution low shear rate relative viscosity vs. α-crystallin volume fraction ϕ, using consistent with SAXS and SLS (see text). (Middle) Normalized diffusivities , from second-order cumulant fits to the DLS-measured ISF . m2/s is the free-particle diffusion coefficient as ϕ approaches 0. Dashed line: the HS theory . (Bottom) DLS vs. delay time t; q = 0.023 nm−1. Progressively slower decays with increasing ϕ are qualitatively similar to those from MD simulations (Fig. S4, Top). Slow relaxation times for which (dashed line) are shown in Fig. 5 (Left).

