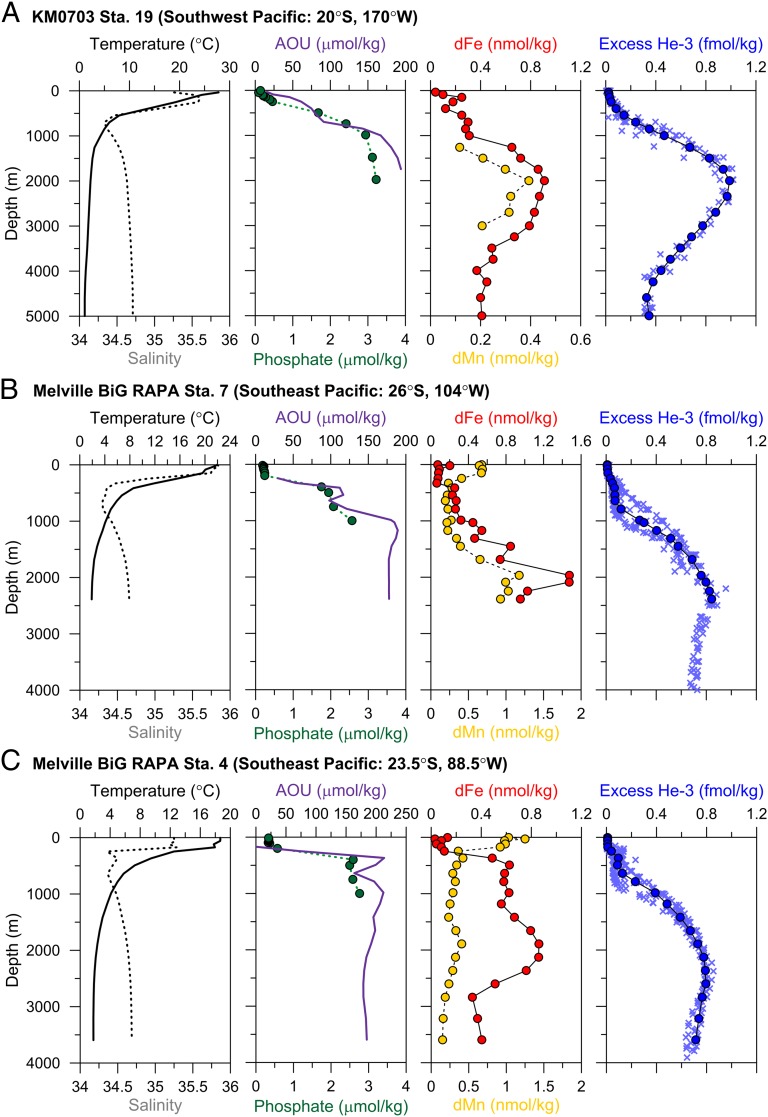
Fig. 2.
Oceanographic profiles showing a hydrothermal influence on dFe, 3He, and dMn at 2,000 m. Relevant profiles taken from (A) SPEEDO-KM0703 Station 19 in the southwest Pacific, (B) Melville BiG RAPA Station 7 in the southeast Pacific, and (C) Melville BiG RAPA Station 4 in the southeast Pacific. Note that dFe SDs on replicate analyses (tabulated in Table S1) were typically the size of the symbol and are thus not shown. The interpolated excess 3He data are shown as blue circles at the depths where dFe measurements were made, whereas the data used to generate those average values are shown as light blue crosses.

