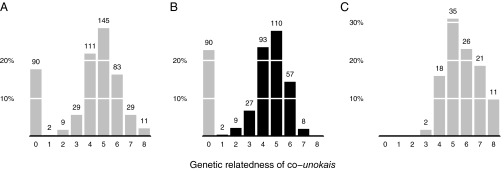
Fig. 2.

Genetic relatedness of co-unokai dyads. (A) Histogram of coefficients of relatedness among co-unokais grouped into nine relatedness categories (n = 509): 0 = no relatedness; 1 = 0.0039–0.0077; 2 = 0.0078–0.014; 3 = 0.015–0.03; 4 = 0.031–0.062; 5 = 0.063–0.124; 6 = 0.125–0.249; 7 = 0.25–0.49; 8 ≥ 0.5. (B) Histogram of coefficients of relatedness among co-unokais who are from different patrilines, grouped into nine relatedness categories (n = 396). Dark bars represent maternal kin. (C) Histogram of coefficients of relatedness among co-unokais who are from the same patriline, grouped into nine relatedness categories (n = 113). The numbers above the bars are counts of co-unokai dyads.
