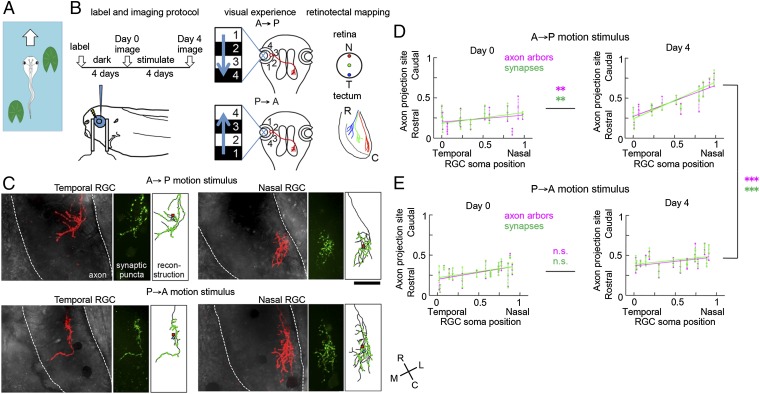
Fig. 1.
Retinotopic map refinement is regulated by the direction of optic flow. (A) Tadpoles swim forward, so they experience a predominant A→P optic flow. (B) Schematic of experimental protocol. RGCs were labeled with TdTomato and Syn-GFP (Bottom Left). Animals were exposed to A→P or P→A moving stimuli for 10 h/d for 4 d. Retinotectal axons were imaged before and after visual stimulation. Positions of labeled RGC somata and axon arbors were determined. N and T mark the nasal and temporal retina; R and C mark the rostral and caudal tectum. (C) Representative images of axon arbors collected after 4 d of A→P (Top) or P→A (Bottom) motion stimulus superimposed on a DIC image of the tectum (Left). (Middle) Images of Syn-GFP puncta. (Right) Reconstructions of axons (black lines) showing puncta (green) and centers of mass for axons (red squares) and synapses (blue triangles). Positions of somata as percentiles along the temporo-nasal axis are 0, 87 (A→P), and 2, 88 (P→A) (from Left to Right). (Scale bar, 100 µm.) (D and E) Topographic maps before and after A→P (D) or P→A (E) visual motion stimulus. Relative positions of RGC somata along the temporo-nasal retinal axis and the centers of mass of the retinotectal axon arbors (magenta) and Syn-GFP puncta (green) along the rostrocaudal tectal axis are mapped. Bars indicate 25th and 75th percentiles of the distribution of axon branches along the rostrocaudal tectal axis. Before visual experience, soma positions and axon projection sites are not significantly correlated (D, axon arbors, R = 0.34, P > 0.2; synapses, R = 0.56, P > 0.09) or weakly correlated (E, axon arbors, R = 0.61, P = 0.013; synapses, R = 0.57, P = 0.022). Somata positions and axon projection sites were clearly correlated after 4 d of A→P motion stimulus (D, axon arbors, R = 0.89, P < 0.001; synapses, R > 0.9, P < 0.001), but not after 4 d of exposure to P→A stimulus (E, axon arbors, R = 0.45, P = 0.066; synapses, R = 0.43, P = 0.094). Retinotopy was sharpened after 4 d of A→P stimulus, not after P→A stimulus [ANCOVA (day 0, day 4), A→P, **P < 0.01 (axons, synapses), n = 13 (axons) and 11 (synapses); P→A, P > 0.4 (axons), P > 0.6 (synapses). n = 13]. Retinotopy was significantly different after 4 d of A→P and P→A stimulus [ANCOVA (A→P, P→A), ***P < 0.001, n = 13 (A→P, synapse, 11) and 16 (P→A)], not before the stimulation [P > 0.3 (axons) and P = 0.9 (synapses)]. The rostrocaudal extents of the arbors are not significantly different between A→P and P→A samples on day 4 (P = 0.36).

