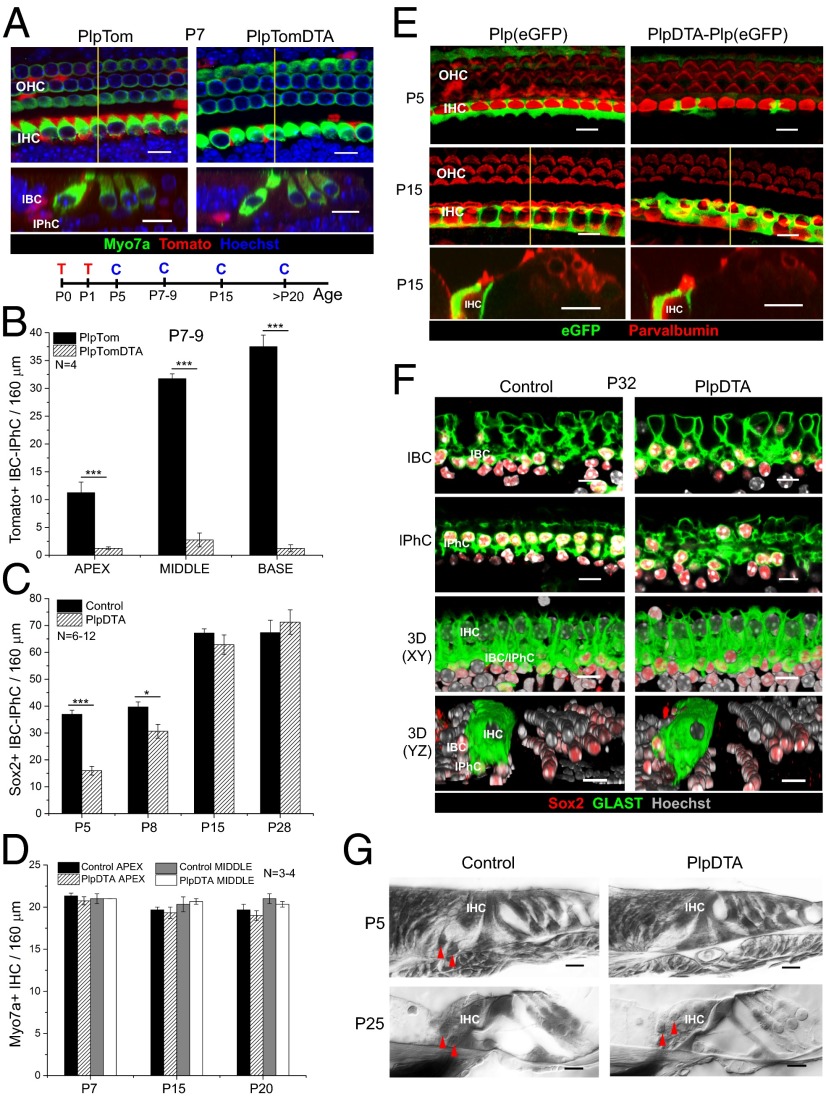
Fig. 1.
IBCs/IPhCs are specifically ablated in the neonatal organ of Corti of PlpDTA mice and are completely repopulated between P8 and P15. (A) Representative optical sections of whole mounts (Upper) and optical cross-sections extracted from z-stacks (Lower) from the middle turn of the cochleae of P7 PlpTom and PlpTomDTA mice showing Tomato+ IBCs/IPhCs in red, Myo7a+ HCs in green, and nuclei labeled with Hoechst 33342 in blue. The location of the section is indicated by the yellow line in whole mounts. The timeline shows the protocol for tamoxifen injection (T) and cochleae collection (C). (B) Quantification of the total number of Tomato+ IBCs/IPhCs in 160-μm regions of each turn of the cochleae of P7–9 PlpTom and PlpTomDTA mice (mean ± SEM, n = 4). Statistical differences in the number of Tomato+ cells were determined by two-way ANOVA followed by Student t test with Bonferroni correction (C) Quantification of Sox2+ IBC/IPhC nuclei surrounding IHCs in 160-μm regions of the middle turn of the cochleae in PlpDTA and control mice at P5, P8, P15, and P21 (mean ± SEM; n = 6–12). Statistical differences between groups were determined using Student’s t test. (D) Quantification of IHC numbers in 160-μm regions of the apical and middle turns of the cochleae of PlpDTA and control mice at P7, P15, and P20 (mean ± SEM, n = 3–4). (E, Top and Middle) Representative optical projections of whole mounts from the apical turn of the cochleae of Plp(eGFP) and PlpDTA-Plp(eGFP) mice at P5 (Top) and P15 (Middle). (Bottom) Optical cross-sections extracted from z-stacks at P15. eGFP (green) reports Plp gene expression in cells around the IHCs (labeled with parvalbumin in red). The location of the section is indicated by the yellow line in P15 whole mounts. (F) Representative optical sections and 3D reconstructions in two planes (x–y and y–z) of whole mounts from the apical turns of the cochleae of PlpDTA and control mice at P32. The two sets of upper panels show optical planes at IBC and IPhC levels, respectively, showing GLAST expression in green, Sox2+ nuclei in red, and Hoechst in gray scale. The two lower sets of panels show 3D reconstruction of z-stacks of the x–y and y–z axes, respectively. (G) Plastic cross-sections of the P5 and P25 organ of Corti of PlpDTA and control mice showing the lack of IBC/IPhC nuclei at P5 but not at P25 in PlpDTA mice. Red arrowheads indicate the positions of IBC/IPhC nuclei in PlpDTA and control mice. (Scale bars: 10 μm.) *P < 0.05, ***P < 0.001.

