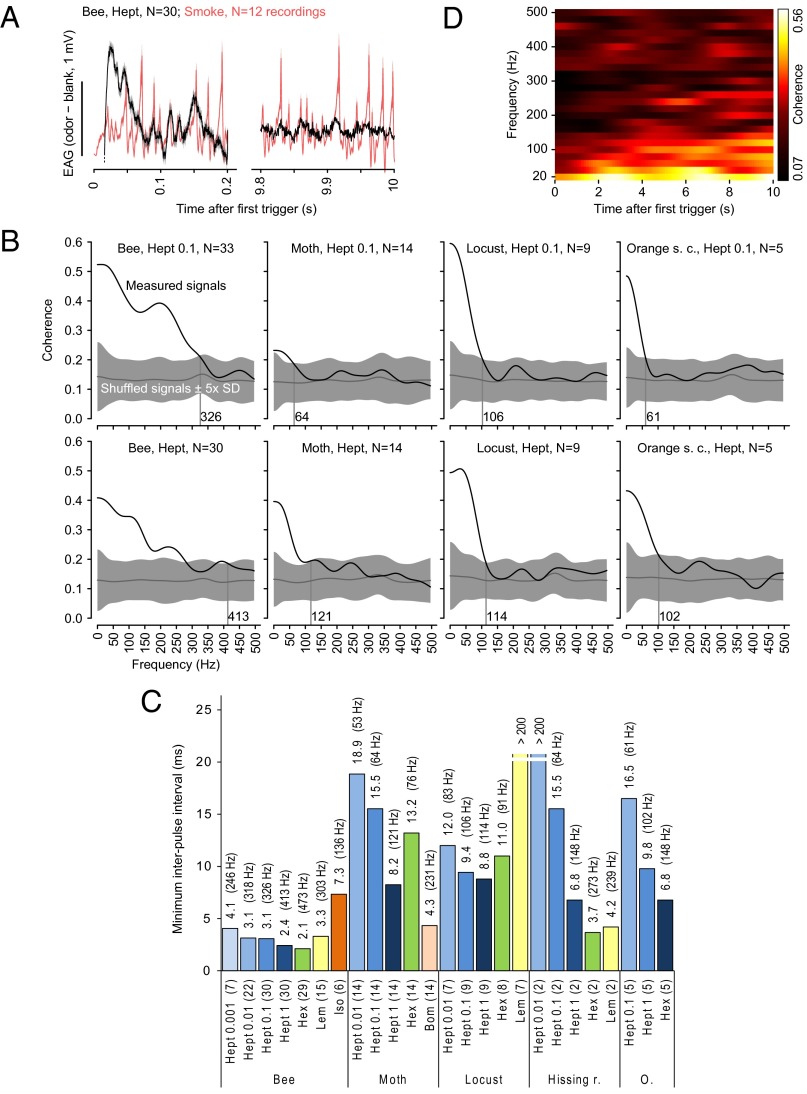
Fig. 4.
Antennal responses track odor fluctuations in the hundreds of Hertz range during a persistent broadband stimulus. (A) TiCl4 smoke signals (red, n = 12) and odor-evoked EAG responses (black, 20 Hz high-pass filtered, onset truncated, n = 30) (mean ± SEM) during 0–0.2 and 9.8–10 s of a 10-s-long broadband frequency stimulus train with random pulse durations and intervals. (B) Coherence between mean EAG responses and TiCl4 smoke signals (black) and coherence between mean EAG response and a shuffled TiCl4 smoke signal (gray, mean ± 5 SD). The first 1,000 and the last 100 ms of the 10-s-long broadband stimulus were skipped to avoid onset/offset effects. Coherence was defined significant when it was larger than the coherence for the shuffled data plus 5 SD. Values at the vertical lines are the maximum frequencies at which the EAG response shows significant coherence. (C) Temporal resolution of EAG responses quantified as the minimum interpulse interval in milliseconds (1/maximum pulse frequency) at which the coherence was significant, i.e., larger than the coherence for the shuffled data plus 5 SD. The corresponding pulse tracking frequencies are given in parentheses. Experiments are grouped at the bottom by species and then odorant and dilution, with the number of antennae in parentheses. (D) Time-resolved, color-coded coherence between the mean honey bee EAG response to undiluted 2-heptanone and the mean TiCl4 smoke signal (same data as in Fig. 4A). The time-resolved coherence indicates the degree to which the EAG response is phase-locked to the fluctuations of the odor concentration, as opposed to merely matching the frequency. Substantial coherence at high frequencies is visible throughout the odor presentation, indicating that tracking can persist for several seconds.

