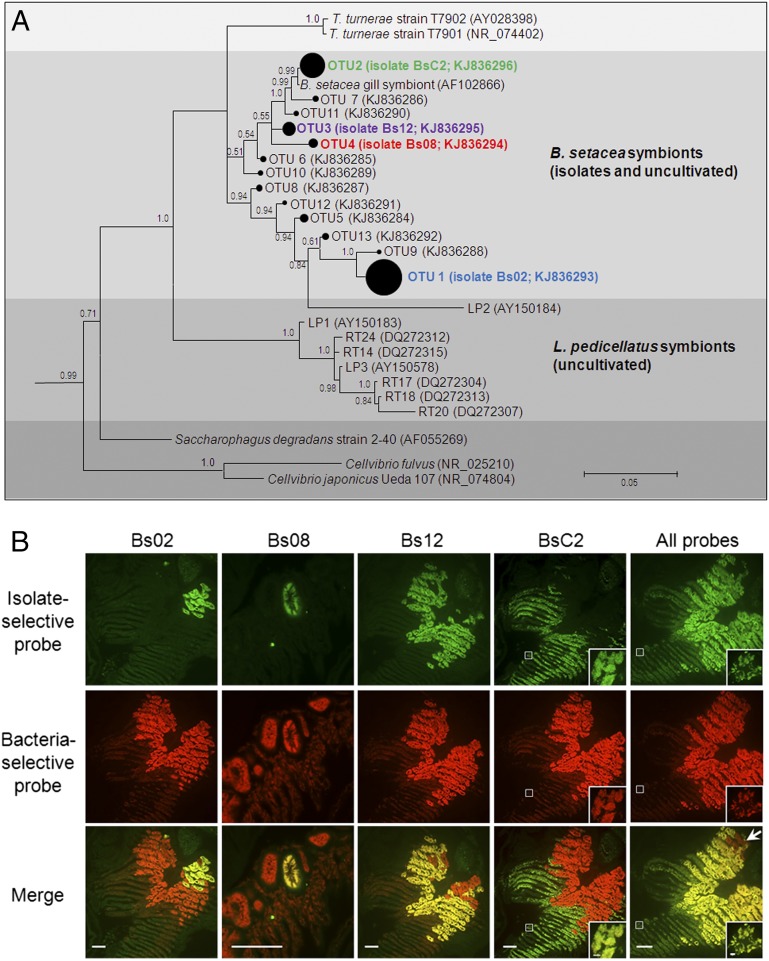
Fig. 2.
Gill endosymbiont community of B. setacea. (A) Bayesian phylogeny (16S rRNA) of cultivated and uncultivated gill endosymbionts of B. setacea (subtree from Fig. S1A). The area of closed circles is proportional to the fraction of the clone library represented by each OTU (Table S2). Posterior probabilities >0.5 are shown. (Scale bar: 0.05 substitutions per nucleotide position.) (B) FISH showing five gill tissue sections from B. setacea (columns), each dual-labeled with a bacteria-selective probe (EUB338; red) plus the indicated isolate-selective probe (green). (Scale bars: 100 μm.) Colocalization (yellow) of bacteria- and isolate-selective probes demonstrates that the four isolates account for most but not all (arrow) detectable gill endosymbionts. (Insets) Details of the boxed areas at a magnification and exposure appropriate to demonstrate the fainter but clearly detectable fluorescence in BsC2 containing bacteriocytes. (Scale bar: 5 μm.) Negative controls are shown in Fig. S1B.

