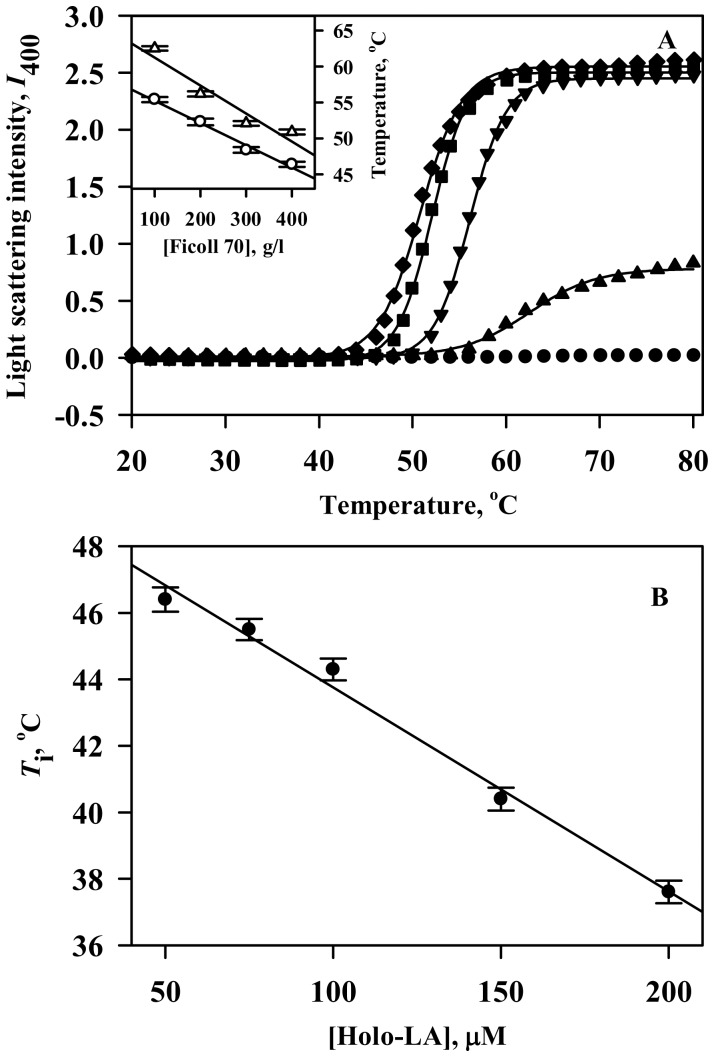
Figure 1. Temperature-dependent aggregation profiles of holo-LA.
(A) The temperature dependence of the light scattering intensity at 400 nm of holo-LA in the absence and presence of varying [Ficoll 70], the molar concentration of Ficoll 70. The lines represent the best-fits (using Equation 1) of data obtained in the presence of 0 g/l (solid circle), 100 g/l (solid triangle), 200 g/l (solid inverted triangle), 300 g/l (solid square) and 400 g/l (solid diamond) Ficoll 70. Inset shows the plot of T agg (open triangle) and T i (open circle) versus [Ficoll 70]. (B) Plot of T i versus [holo-LA].

