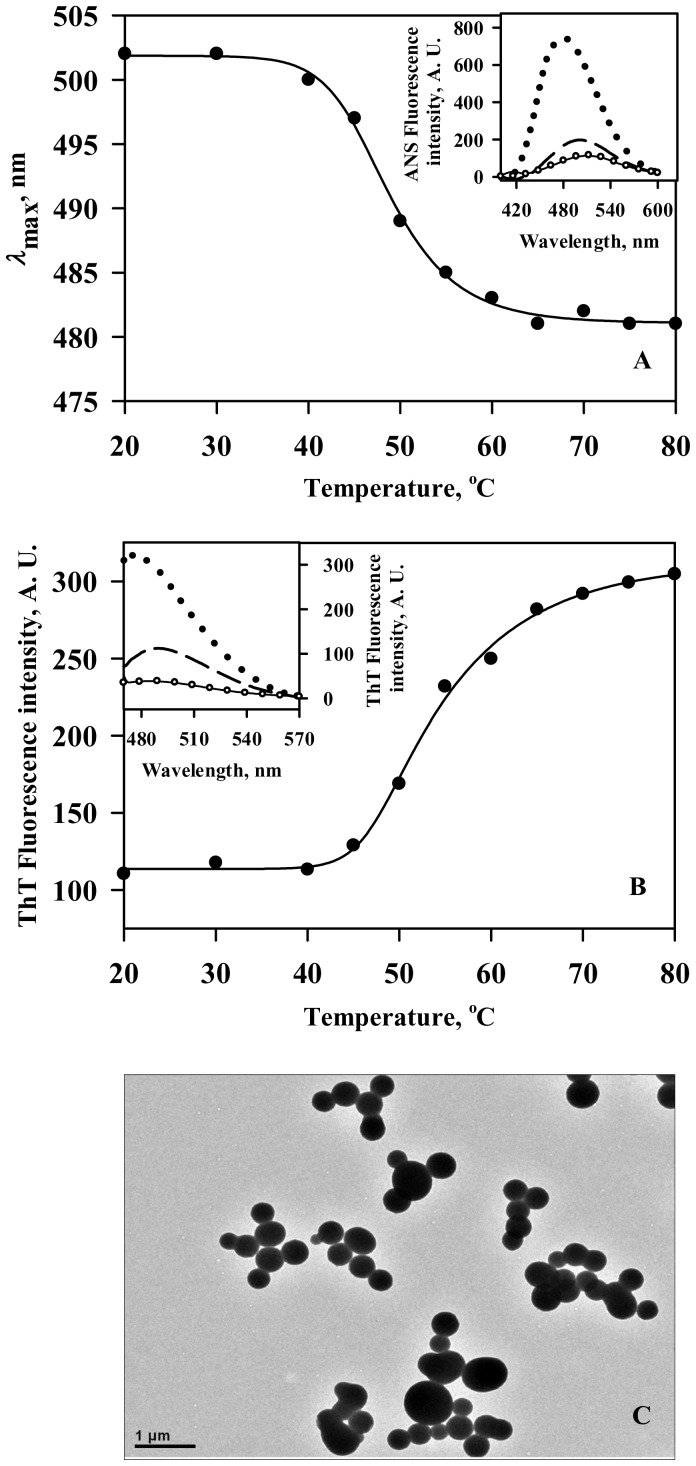
Figure 2. Characterization of the Ficoll 70-induced holo-LA aggregates.
(A) Plot of ANS binding profile (λ max versus temperature) of holo-LA aggregates formed in the presence of Ficoll 70 at different temperatures. Inset shows the representative ANS binding profiles of holo-LA in the absence (20°C: solid line; 80°C: open circle) and presence of Ficoll 70 (20°C: dashed line; 80°C: dotted line). (B) Plot of ThT binding profile (ThT fluorescence intensity at 485 nm versus temperature) of holo-LA aggregates formed in the presence of Ficoll 70 at different temperatures. Inset shows the representative ThT binding spectra of holo-LA aggregates formed in the absence (20°C: solid line; 80°C: open circle) and presence of Ficoll 70 (20°C: dashed line; 80°C: dotted line). (C) Electron micrograph of holo-LA aggregates following heat-induced denaturation in the presence of 400 g/l Ficoll 70.

