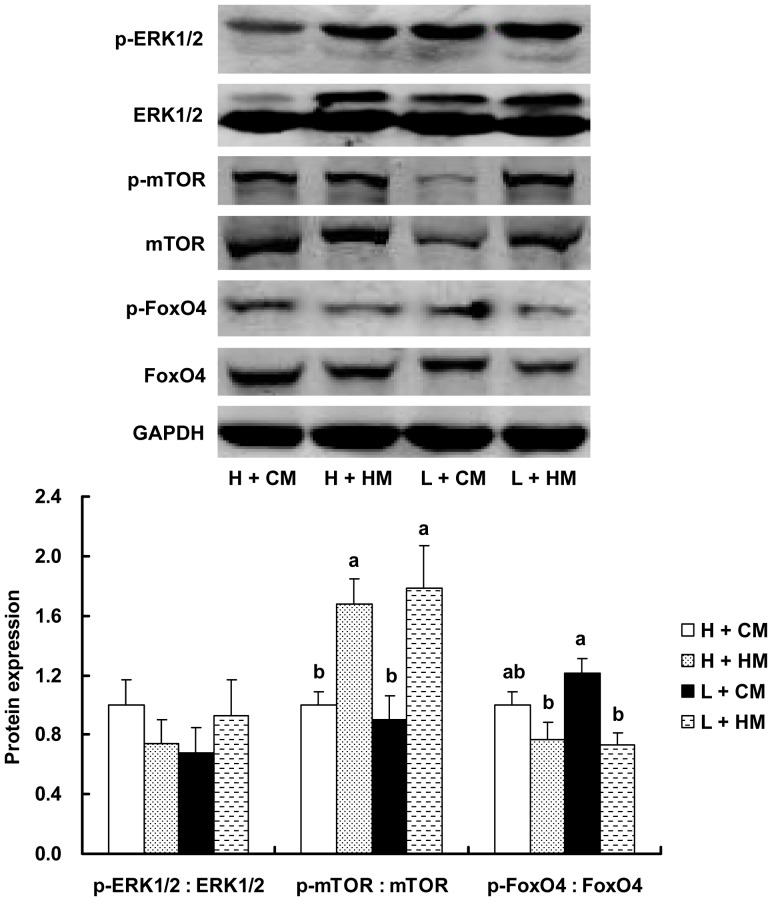
Figure 1. Phosphorylation of ERK1/2, mTOR and FoxO4.
Western blot analysis (up) and quantification of the results (down) are shown. H - heavy (48.3±0.1 g); L - light (41.7±0.1 g); CM – control methionine levels (0.50% and 0.43% methionine during 1–21 d and 22–42 d, respectively); HM - high methionine levels (0.60% and 0.53% methionine during 1–21 d and 22–42 d, respectively). Different superscripts indicate significant differences (P<0.05).

