
Figure 8. Time course analysis showing PR1 downregulation at 8 hours in the KO-nudx8 mutant.
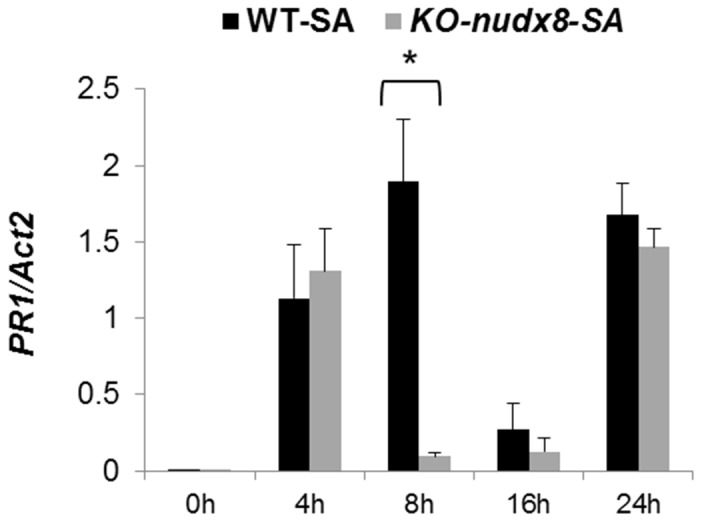
qRT-PCR analysis of PR1 relative expression levels in a 24 hour time course in the leaves of WT plants and KO-nudx8 mutant treated with 1 mM SA. Expression of PR1 was downregulated at 8 hours in the KO-nudx8 mutant compared to WT. Three-week-old plants were sprayed with 1 mM of SA and samples were collected at different time points. Bars represent change in expression of PR1 transcript in the WT and KO-nudx8 plants relative to the internal control ACTIN2 used as reference gene (since it does not vary under the different conditions and treatments tested). Relative expression values were normalized to ACTIN2 mRNA using the ΔΔCT method. Data are reported as means ±SD of three independent biological replicates. Asterisk indicates significant difference according to Student's t test (P<0.05). Zeitgeber time is indicated from the time the lights were turned on at 0 hour for a period of 24 hours.