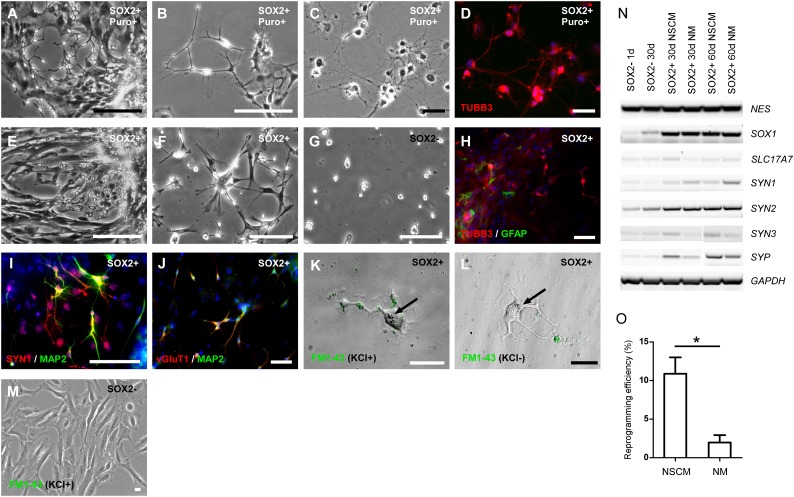
Figure 2.
Characterization of induced neurons selected using puromycin resistance or neural stem cell medium after SOX2 lentiviral transduction. (A–D): Human fetal retinal pigmented epithelial (hfRPE) cells (fRPE1914) transduced with SOX2 and selected by puromycin. (A): Representative image of RPE cells transduced with SOX2 that were cultured in RPE medium with puromycin for 15 days. Scale bar = 400 μm. (B): Representative image of RPE cells transduced with SOX2 selected by puromycin for 30 days. Scale bar = 100 μm. (C, D): Representative images of hfRPE cells at 90 days after transduction with SOX2, showing typical neuronal morphology (C) and immunofluorescent staining showing expression of a neuronal marker, TUBB3 (red) (D). Scale bars = 50 μm. (E–J): RPE cells transduced with SOX2 and cultured in neural stem cell (NSC) medium. (E–G): Human fetal RPE cells (fRPE1914). (E): Representative image of RPE cells transduced with SOX2 and cultured in NSC medium for 30 days. Scale bars = 400 μm. (F): RPE cells from Figure 2E attached and proliferating on laminin-coated plates at 24 hours after plating. (G): Fewer normal RPE cells attached on laminin-coated plates at 48 hours after plating. Scale bar = 200 μm. (H–J): Human embryonic stem cell-derived (hESC-derived) RPE cells transduced with SOX2 and cultured in NSC medium. (H): Immunofluorescent staining of hESC-derived RPE cells transduced with SOX2, using antibodies against a neuronal marker (TUBB3, red), and glial marker (GFAP, green) at 40 days after infection. (I): Immunofluorescent staining using antibodies against SYN1 (red) and MAP2 (green) at 60 days after infection. (J): Immunofluorescent staining using antibodies against vGluT1 (red) and MAP2 (green) at 60 days after infection. Scale bars = 50 μm. (K–M): Potassium-stimulated uptake of FM1-43 at 90 days after infection. (K): After addition of potassium, neuron-like cells were labeled with FM1-43 in a punctate pattern. (L): Without potassium stimulation, no FM1-43 uptake was detected. (M): Potassium-stimulated FM1-43 uptake was not detected in parental RPE cells. Black arrows: pigmented particles inside induced neuronal cells. Scale bars = 20 μm. (N): Reverse transcription polymerase chain reaction analysis of SOX2-transduced RPE cells at different time points and in different cell culture media. (O): Comparison of reprogramming efficiency in different cell culture media. Student’s t test, n = 3, p = .01956. ∗, p < .05. Abbreviations: d, days; NSCM, neural stem cell medium; NM, neuronal medium (Neurobasal with N2); Puro, puromycin.

