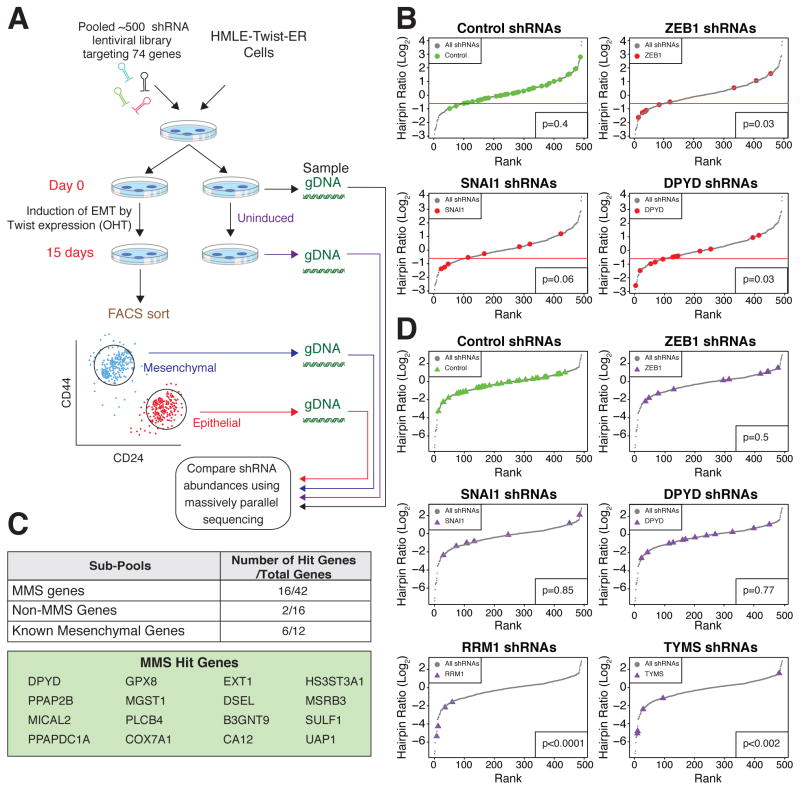
Figure 3. A FACS-based pooled shRNA screen identifies DPYD as required for EMT.
(A) Schematic presentation of the FACS-based pooled shRNA screen. OHT, hydroxytamoxifen; gDNA, genomic DNA.
(B) DPYD knockdown (KD) inhibits the EMT. All hairpins from the screen were ranked based on the log2 ratio of their abundance in the mesenchymal relative to the epithelial population of OHT-induced HMLE-Twist-ER cells after FACS sorting (see Figure 3A). Hairpin sub-pools pictured include those targeting control genes (39 hairpins targeting RFP, GFP, luciferase, and LacZ), ZEB1 (9 hairpins), SNAI1 (8 hairpins), and DPYD (12 hairpins). One standard deviation below the mean of the distribution of the control hairpins was set as a cutoff (red line). Every hairpin with a log2 ratio below the cutoff was considered a hit. The significance of the differences in distribution between the selected genes and the other genes in the screen was quantified using the Student’s T test.
(C) Several of the MMS genes are critical for the EMT. Genes with at least two hairpins scoring below the cutoff (see panel B) were classified as hit genes. The numbers in the table represent the hit genes as a fraction of the total genes in a given sub-pool.
(D) DPYD KD does not affect cell viability. All hairpins were ranked based on the log2 ratio of their abundance in uninduced HMLE-Twist-ER cells on day 15 relative to day 0. The same hairpin sub-pools as in (B), with the addition of shRNAs targeting the essential genes RRM1 (4 hairpins) and TYMS (5 hairpins), are shown. The significance of the differences in distribution between the selected genes and the control genes was quantified using Student’s T test.

