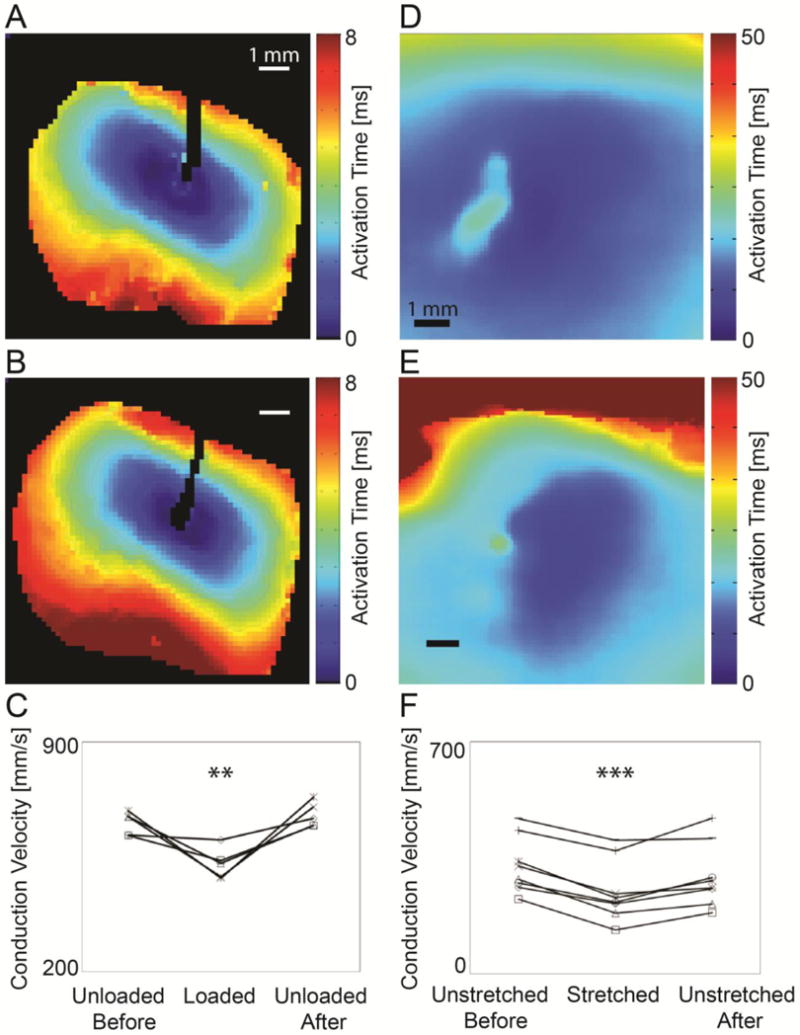
Figure 1.

Effects of stretch on conduction velocity measured by fluorescence optical mapping in isolated hearts (A–C) and in micropatterned cardiomyocytes (D–F). Isochronal maps from the epicardium of an isolated WT mouse heart before (A) and after (B) ventricular pressure loading and from micropatterned neonatal ventricular myocyte cultures before (D) and after (E) anisotropic stretch show prolongation of activation times indicating conduction slowing during mechanical loading (scale 1 mm). Maximal epicardial conduction velocity (CVmax) in isolated mouse hearts (C) decreased significantly and reversibly during loading (N=5, **P<0.01). Maximal conduction velocity (CVmax) in cultured myocytes (F) decreased significantly and reversibly with stretch (N=8, ***P<0.001).
