Figure 2.
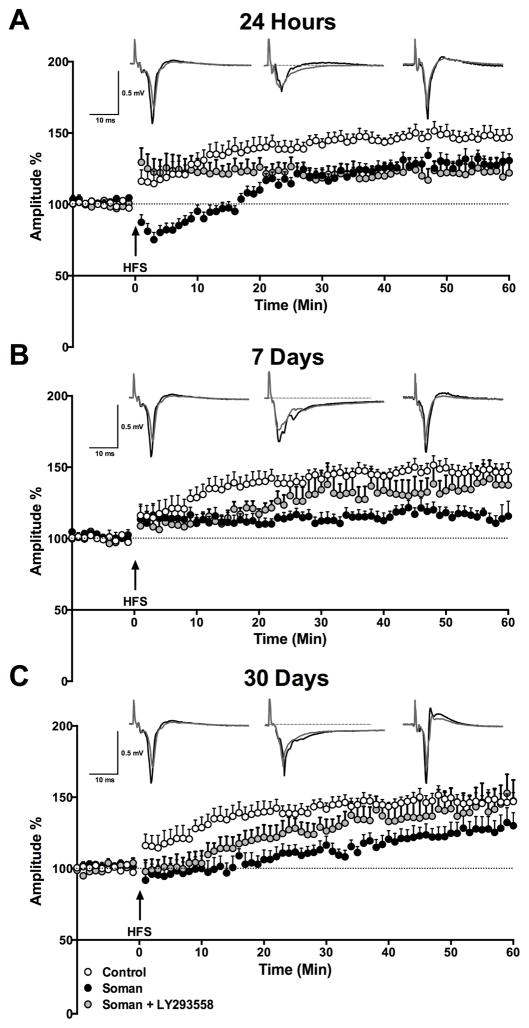
Effects of soman and LY293558 treatment on long-term potentiation in the BLA. The plots show the time course of the changes in the amplitudes of the field potentials after high- frequency stimulation (HFS), in control rats (open circles), soman-exposed rats (black circles), and soman-exposed rats treated with LY293558 (gray circles). The amplitudes of 3 responses recorded in each min (stimulation at 0.05 Hz) were averaged, and each data point on the plot is the mean and standard error of these averages, from 7–12 slices (see sample sizes in the text). Traces over the plots are examples from a control rat (left), soman-exposed rats (middle), and soman+LY293558 treated rats (right); the superimposed field potentials are a baseline response (gray) and a response at 50–60 min after HFS (black; each trace is the average of 20 sweeps;). A. At 24 h after soman exposure, potentiation of the responses, measured at 50–60 min after HFS, was significantly lower–compared to the control group–in both the soman and the soman+LY293558 groups. B. Seven days post-exposure, potentiation of the response in the soman+LY293558 treated animals was not significantly lower than in controls, while potentiation in the soman group remained significantly reduced. C. Thirty days after exposure, there was no significant difference between the groups in the potentiation of the responses.

