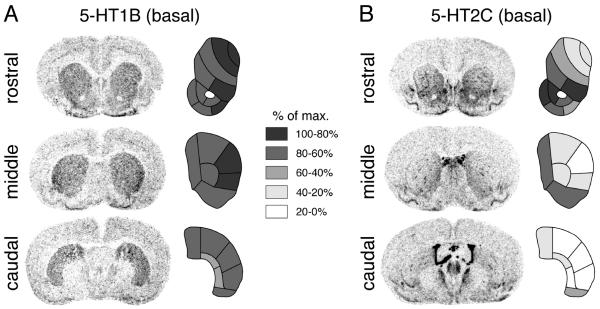
Figure 4.
Expression of 5-HT1B (A) and 5-HT2C (B) receptor mRNAs in the striatum. Illustrations of film autoradiograms (left) depict “basal” 5-HT1B and 5-HT2C expression (i.e., in vehicle-treated rats, n=6) in coronal sections from the rostral, middle and caudal striatum. The maps (right) show the distribution of gene expression across the 23 striatal sectors. Values are given as percentages of maximal expression and are coded as indicated. The maximal hybridization signal is black.

