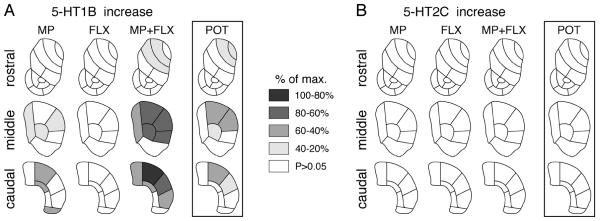
Figure 5.

Topography of changes in 5-HT receptor expression in the striatum after repeated methylphenidate plus fluoxetine treatment. Maps depict the distribution of the increases in 5-HT1B expression (A) and the lack of changes in 5-HT2C expression (B) in the rostral, middle and caudal striatum after the 5-day treatment with methylphenidate (5 mg/kg, i.p.; MP), fluoxetine (5 mg/kg; FLX) or methylphenidate+fluoxetine (5 mg/kg each; MP+FLX). The potentiation (POT) denotes the difference between methylphenidate+fluoxetine and methylphenidate alone. The differences are expressed relative to the maximal difference for each gene (% of max.). Sectors with significant differences (P<0.05) are coded as indicated. Sectors without significant effects are in white.
