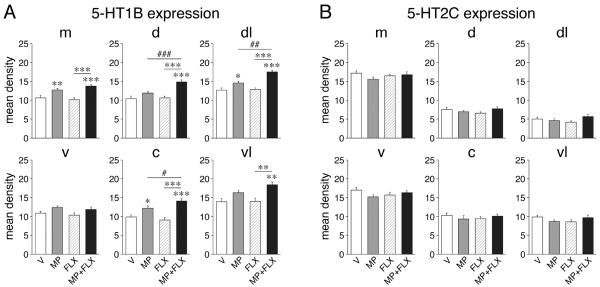
Figure 6.
Changes in striatal 5-HT receptor expression after repeated methylphenidate plus fluoxetine treatment. The changes in 5-HT1B expression (A) and the lack of changes in 5-HT2C expression (B) in the 6 middle striatal sectors are shown. Mean density values (mean±SEM) are given for rats that received 5 daily injections of vehicle (V), methylphenidate (5 mg/kg; MP), fluoxetine (5 mg/kg; FLX), or methylphenidate+fluoxetine (MP+FLX) (n=6-9 per group). Sectors: m, medial; d, dorsal; dl, dorsolateral; v, ventral; c, central; vl, ventrolateral. * P<0.05, ** P<0.01, *** P<0.001 vs. V controls or as indicated; # P<0.05, ## P<0.01, ### P<0.001, MP+FLX vs. MP (potentiation).

