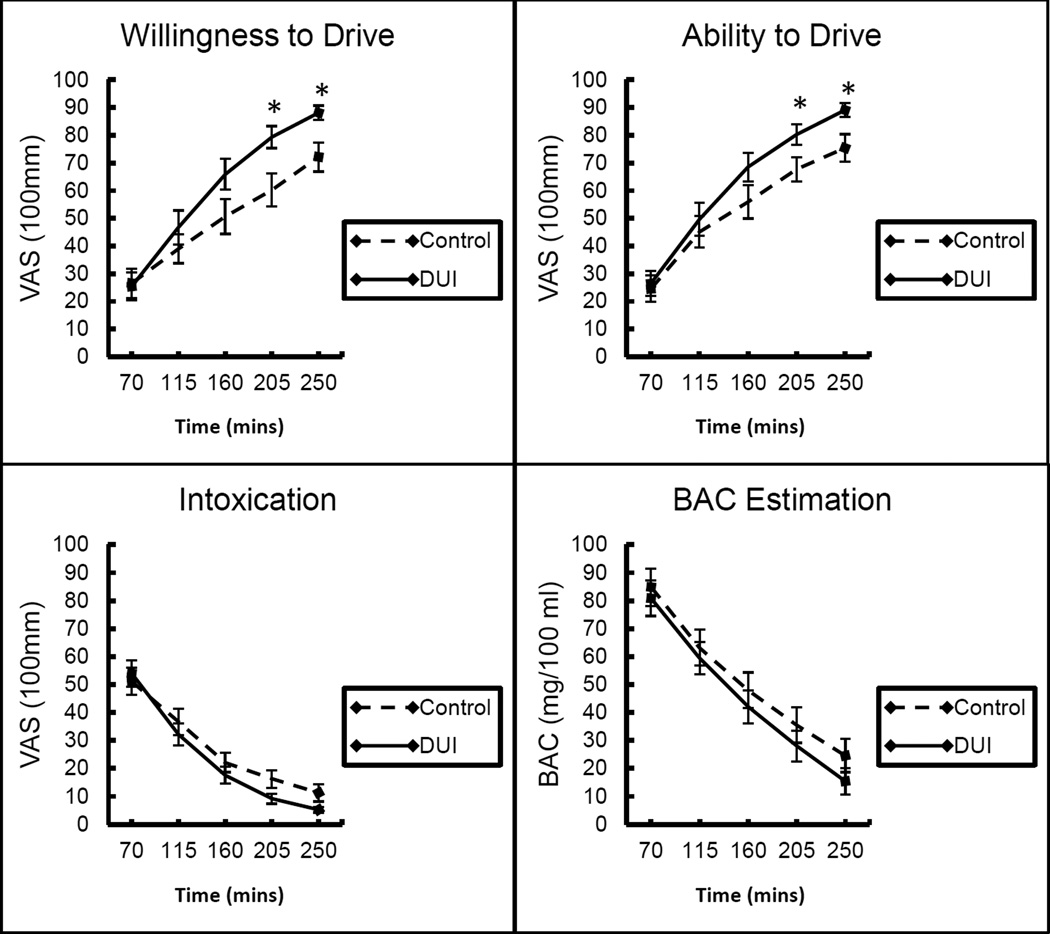
Figure 2. Perceived driving fitness.
Top left = mean willingness to drive ratings on 100-point visual analogue scales following 0.65 g/kg alcohol for DUI and control drivers. Top right = mean subjective rating of driving ability on 100-point visual analogue scales following 0.65 g/kg alcohol for DUI and control drivers. Bottom left = mean subjective intoxication ratings on 100-point visual analogue scales following 0.65 g/kg alcohol for DUI and control drivers. Bottom right = mean BAC estimation ratings on a scale ranging from 0.0 g/% to 0.16 g/% following 0.65 g/kg alcohol for DUI and control drivers. Error bars indicate standard error of the mean. * denotes significant group difference.

