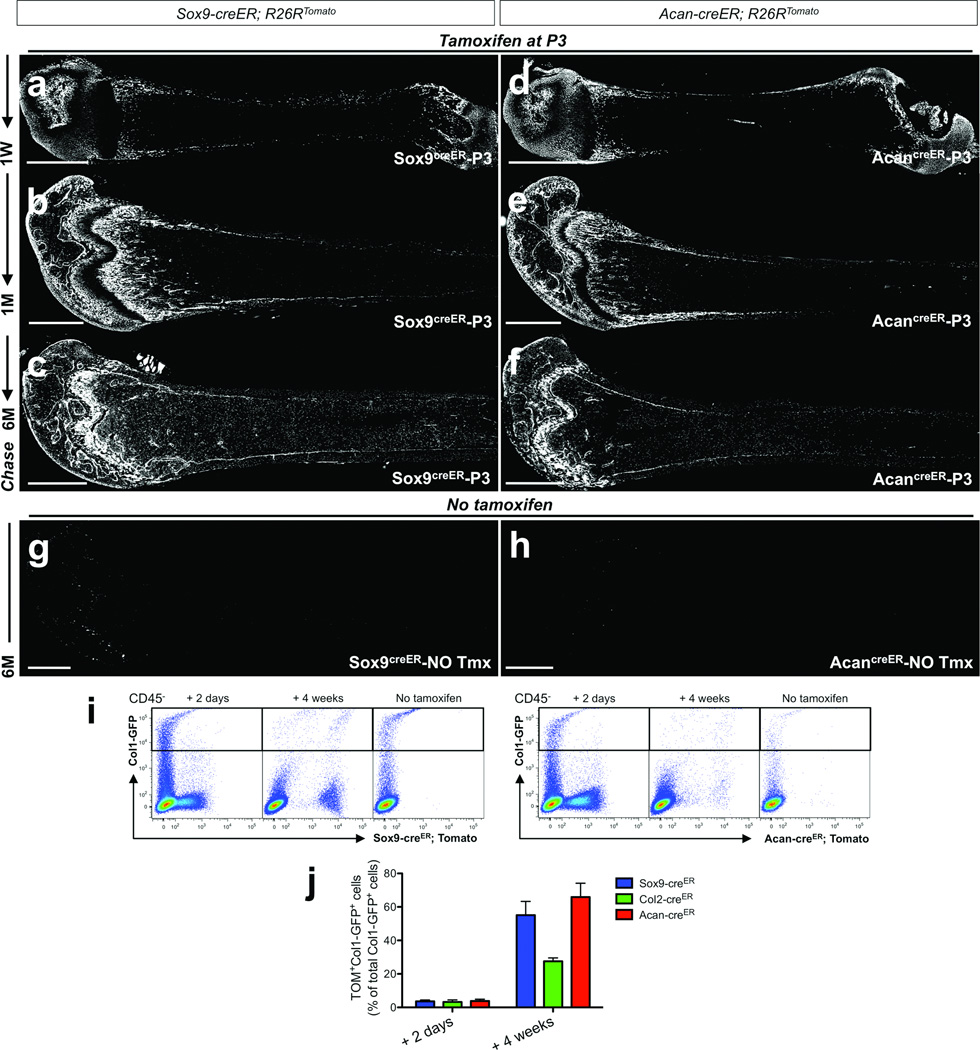
Figure 6. Sox9-creER+ and Acan-creER+ cells encompass early growth skeletal progenitor cells in postnatal growing bones.
a–f. Lineage-tracing of postnatal Sox9-creER+ and Acan-creER+ cells was performed by injecting 0.1mg tamoxifen into P3 mice. Sox9-creER; R26RTomato (a–c) or Acan-creER; R26RTomato (d–f) mice were chased for a week (a,d), a month (b,e) and 6 months (c,f). Shown are femur sections with the distal side on the left. Sox9creER-P3 represents descendants of Sox9-creER+ cells at P3, and AcancreER-P3 represents descendants of Acan-creER+ cells at P3. White indicates tdTomato. Scale bars: 1mm.
g,h. No tamoxifen controls of Sox9-creER; R26RTomato (g) or Acan-creER; R26RTomato (h) mice at 6 months of age. Shown are femur sections with the distal side on the left. White indicates tdTomato. Scale bars: 1mm.
i,j. Flow cytometry analysis was performed using dissociated bone cells harvested from mice that received 0.1mg tamoxifen at P3 (except no tamoxifen controls) and were chased for indicated periods. CD45− fraction was gated for GFP. (i) Representative dot plots of cells from Col1-GFP; Sox9-creER; R26RTomato (left panels) and Col1-GFP; Acan-creER; R26RTomato (right panels) mice. Left subpanels: 2 days chase, middle subpanels: 4 weeks chase, right subpanels: no tamoxifen controls. X-axis represents tdTomato, and Y-axis represents GFP. (j) Percentage of Sox9creER-P3 cells (blue bars), Col2creER-P3 cells (green bars) or AcancreER-P3 cells (red bars) among Col1-GFP+ osteoblasts after 2 days of chase (left group) or 4 weeks of chase (right group) was enumerated. n=3 mice for 2 days chase of Sox9creER-P3 and AcancreER-P3 cells, n=4 mice for 2 days chase of Col2creER-P3 cells, n=8 mice for 4 weeks chase of Sox9creER-P3 cells, n=5 mice for 4 weeks chase of Col2creER-P3 and AcancreER-P3 cells. All data are represented as mean ± SD.

