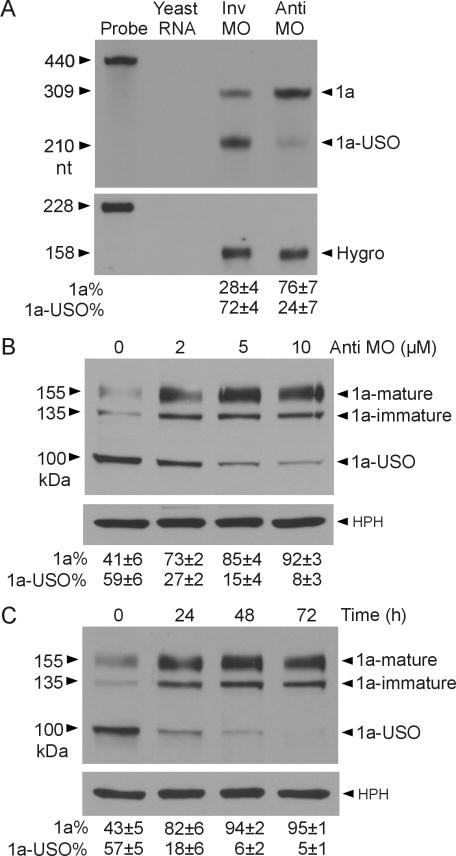
Fig. 4.
Modulation of Kv11.1 isoform expression by antisense MO. (A) RPA analysis of the effect of antisense MO on Kv11.1 isoform expression. Signals were quantified and shown as an isoform percentage of the total signal (1a+1a-USO, mean±SD, n=3). (B) Immunoblot analysis showing concentration dependence of antisense MO effect. Signals were quantified and shown as an isoform percentage of total (1a+1a-USO) Kv11.1 protein (mean±SD, n=3). (C) Time course of antisense MO effect. Signals were quantified and shown as an isoform percentage of total (1a+1a-USO) Kv11.1 protein (mean±SD, n=3).

