
Fig. 3.
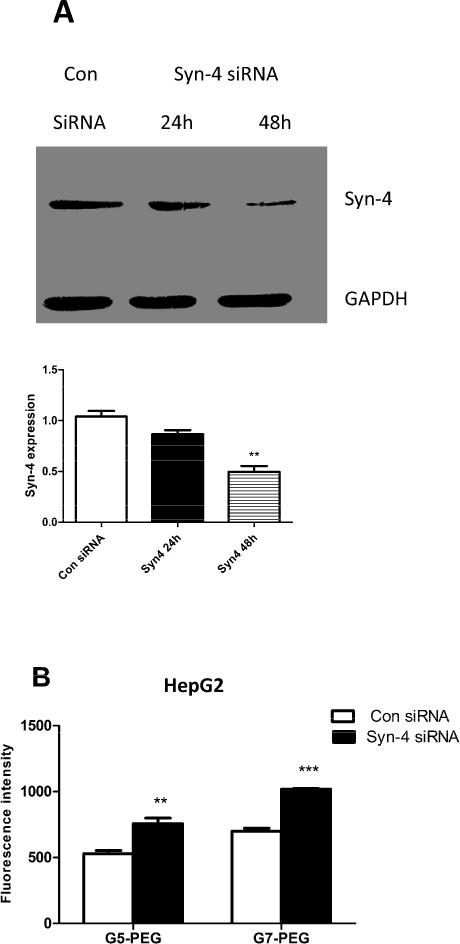
Effect of Syn-4 siRNA treatment on endocytosis of the polyplexes in HepG2 cells. (A) Western blot indicating that expression of Syn-4 was significantly knocked down after 48h (n=3, **p<0.01, compared with the con-siRNA treated group). (B) Fluorescence intensity of the polyplexes in HepG2 cells measured by flow cytometer before and after Syn-4 siRNA treatment. The polyplexes were formed by Cy5 labeled pDNA and PEG-PAMAM dendrimers. (n = 3, ** p<0.01, *** p < 0.001, compared with the con-siRNA treated group).