
Figure 1.
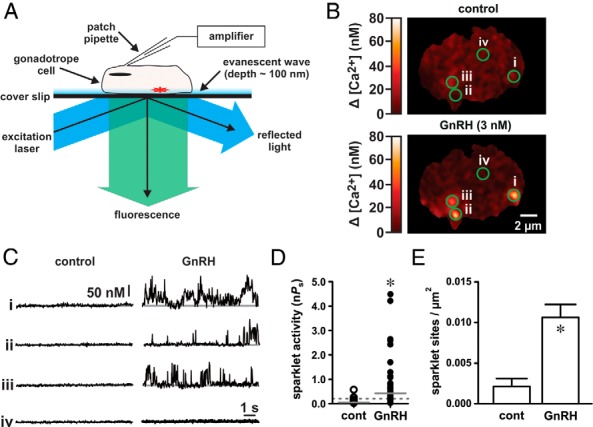
GnRH induces localized Ca2+ influx in αT3–1 cells. A, Schematic illustrating the electrophysiological and TIRF imaging method used to visualize Ca2+ influx in αT3–1 cells. B, Representative TIRF images showing localized Ca2+ influx in αT3–1 cells before and after GnRH (3 nM). C, Traces showing the time course of localized Ca2+ influx at the four circled sites before and after GnRH. The scale bar provides reference for changes in [Ca2+]i during the traces (see Materials and Methods). D, Plot of Ca2+ sparklet site activities (nPs; see Materials and Methods) before and after GnRH (n = 32 cells); solid gray lines are the arithmetic means of each group, and dashed lines mark the threshold for high-activity Ca2+ sparklet sites [nPs ≥ .2; (10)]. E, Plot of mean ± SEM Ca2+ sparklet site densities (Ca2+ sparklet sites/μm2) before and after GnRH (n = 32 cells). *, P < .05. cont, control.