
Figure 6.
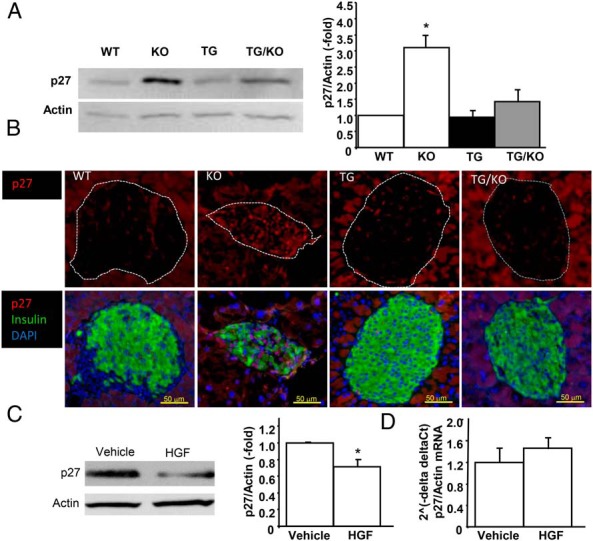
p27 expression levels in RIP-HGF TG mouse islets with IRS2 deficiency and in INS-1 cells treated with HGF. A, Analysis of p27 levels in islet extracts from WT, TG, KO, and TG/KO mice (n = 4/group). A representative Western blot is shown, and the graph with the densitometric calculation of the different samples tested appears on the right of the image. Actin was used as a housekeeping protein. Results are means ± SEM. *, P < .05 vs the other 3 groups of mice. B, Representative photomicrographs of pancreatic sections from WT, TG, KO, and TG/KO mice stained for p27 (red), insulin (green), and DAPI (blue). Notice the increased p27 staining in KO mice compared with that in WT, TG, and TG/KO mice. C and D, Analysis of p27 protein (C) and mRNA expression levels (D) in INS-1 cells treated with 25 ng/mL HGF. A representative Western blot using actin as a housekeeping protein is shown to the left, next to the densitometry quantitation of 3 different blots. Real-time PCR quantitation of p27 mRNA expression in 3 experiments in triplicate is shown to the right using actin as a housekeeping gene. Results are means ± SEM. *, P < .05 vs vehicle-treated cells by the Student t test.