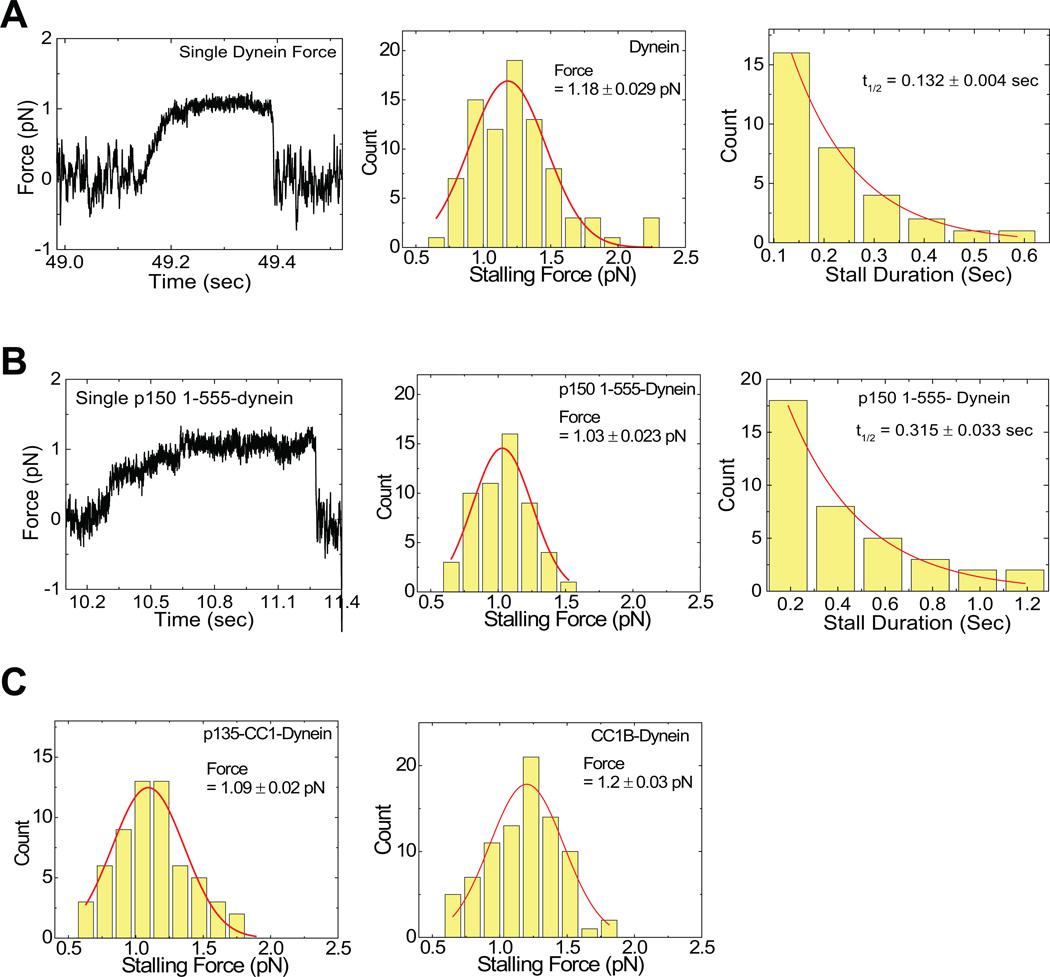
Figure 4. Effects of dynactin fragments on dynein single molecule force production.
(A) reflects dynein alone, and (B) reflects dynein with P150. Shown are example force traces (A, B, Left), distributions of stalling forces (100 force events) (A, B, middle) and distributions of durations of force producing events (40 stalling events) (A,B, Right). C) shows distributions of stalling forces for dynein with P135 (left) and CC1B (right).

