
Figure 15.
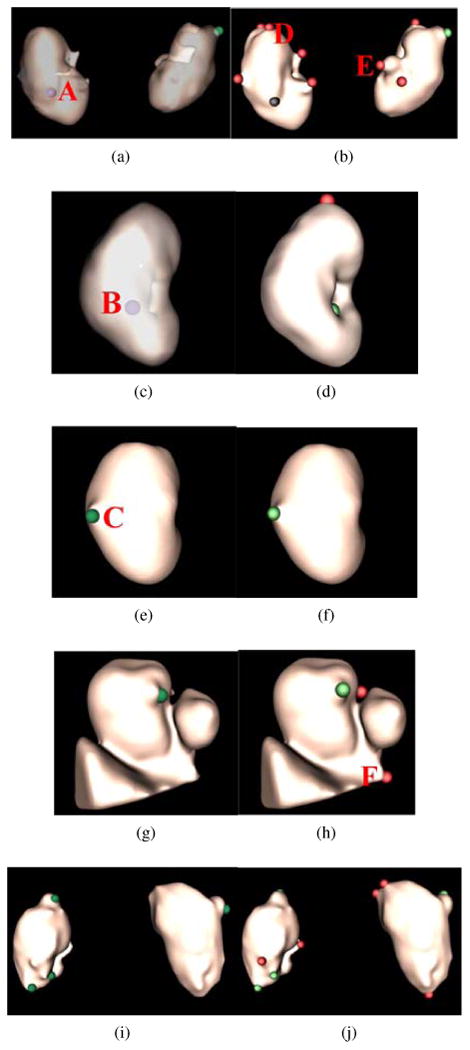
Renal lesion detection on five patient datasets corresponding to five rows. Renal lesion annotations are illustrated in the left column where exophytic lesions are in red and internal lesions in violet. To better observe internal lesions A and B, the kidney surface is transparently visualized in (a) and (c). Lesion detections are presented in the right column, where true positives are in green, false positives in red, and false negatives in black.