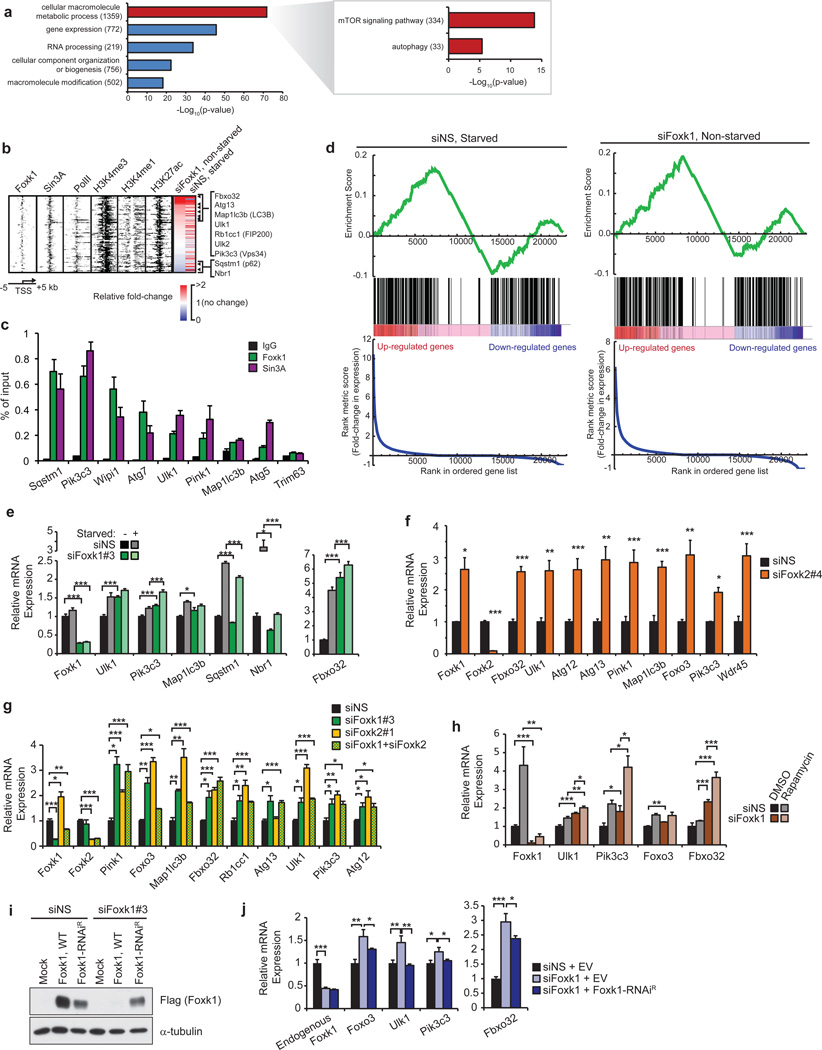
Figure 3. Foxk1 represses transcription of genes associated with induction of atrophy and autophagy initiation.
(a) GO analysis of Foxk1 targets showed enrichment of genes involved in mTOR signaling and autophagy. All indicated p-values are Bonferroni-corrected. Numbers in parentheses indicate the number of Foxk1-bound genes in the respective categories. (b) Heatmap depicting ChIP-seq data for Foxk1, Sin3A, RNA PolII, H3K27ac, H3K4me3, and H3K4me1 at 108 Foxk1-bound autophagy genes significantly deregulated upon Foxk1 knockdown in non-starved conditions. RNA-seq expression, relative to non-starved control conditions, after either starvation or Foxk1 knockdown is displayed to the right. Rows are sorted by fold-change in expression upon Foxk1 knockdown, where red indicates increased, and blue indicates decreased, gene expression. Genes displayed to the right are those known to play important roles in atrophy and autophagy processes. (c) qChIP of Foxk1 and Sin3A at the promoters of autophagy genes. The promoter of Trim63 is a negative control devoid of Foxk1 and Sin3A. (d) Gene set enrichment analysis (GSEA) of atrophy and autophagy genes in starved (left) or Foxk1-depleted (right) myoblasts. Genes are ranked by fold-change in expression relative to control, non-starved cells. Atrophy and autophagy-associated genes are denoted by black bars in the middle of the panels. A normalized enrichment score of 3.5 and 4.1 for starved and Foxk1-depleted cells, respectively, were calculated from the GSEA. Both enrichment scores have a nominal p-value < 0.0001. (e) Quantitative reverse-transcriptase PCR (qRT-PCR) of siRNA-depleted Foxk1 with or without starvation. Foxk1 depletion de-repressed a subset of autophagy genes and Fbxo32 under basal conditions, and starvation further increased expression of some genes beyond levels seen with starvation or knock-down alone. (f) Foxk2 depletion leads to de-repression of a panel of autophagy genes and Fbxo32. (g) Depletion of Foxk1 and Foxk2 alone or together leads to de-repression of autophagy genes and Fbxo32. (h) qRT-PCR of siRNA-depleted Foxk1 with or without rapamycin treatment. (i) Ectopic production of Flag-tagged RNAi-resistant Foxk1 (Foxk1-RNAiR). (j) Transfection with Flag-tagged Foxk1-RNAiR, but not empty vector (EV), restored repression of target genes. All qChIP and qRT-PCR data represent n = three independent biological replicates from separate dishes and lysate preparations, and are presented as mean+SEM. * p <0.05, ** p<0.01, *** p<0.001 (two-tailed t-test).

