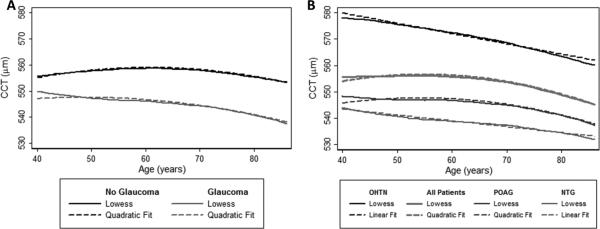
Figure 1. Relationship between central corneal thickness (CCT) and age.

The curvature in the relationship between CCT and age is depicted by a locally-weighted scatterplot smoothing (Lowess) representation of the 81,082 patients in our study sample, as well as a fitted line which included a quadratic term for age as a predictor of CCT. Patients were stratified by (A) presence or absence of glaucoma, and (B) type of glaucoma-related diagnosis, including ocular hypertension (OHTN), all patients regardless of diagnosis, primary open angle glaucoma (POAG), and normal tension glaucoma (NTG).
