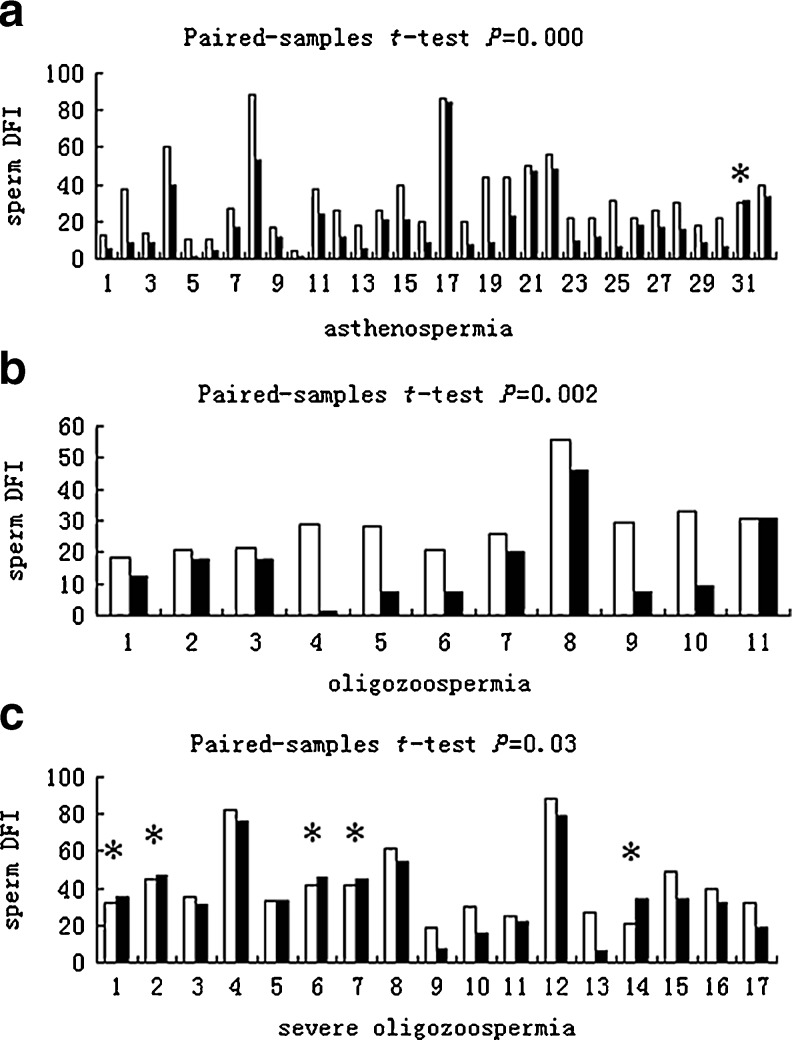
Fig. 2.
The sperm DFI of native semen (white columns) and DGC-processed samples (black columns). The patients are divided into asthenospermia (a), oligozoospermia (b), and severe oligozoospermia (c) groups. Statistical comparisons using the paired-samples t-test are included in the figure. * Sperm DFI increased after DGC preparation

