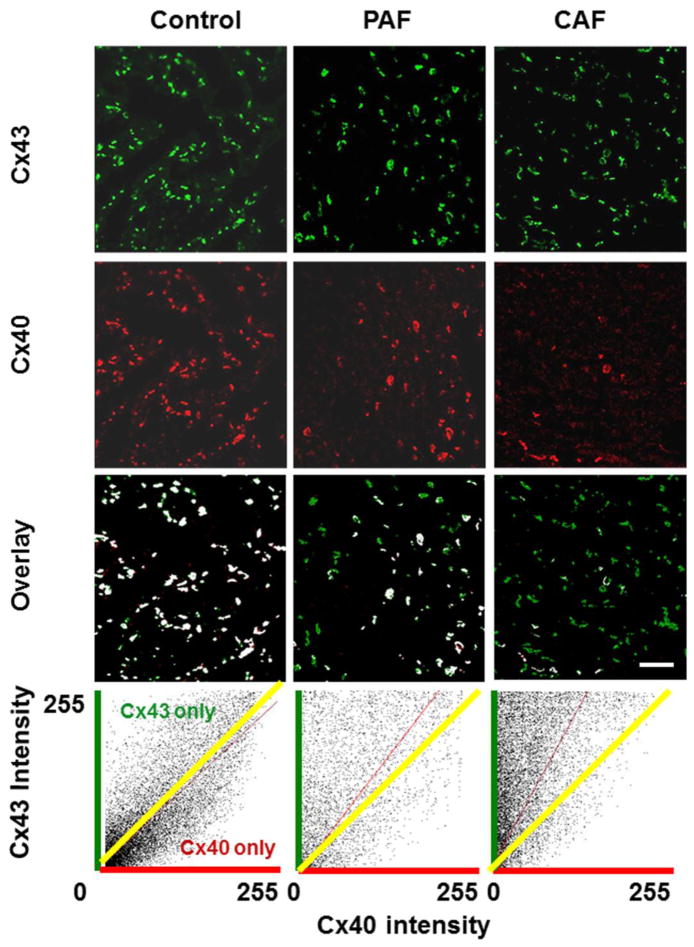
Figure 2. Immunolocalization of Cx43 and Cx40 shows reductions of Cx40 in sections from hearts of patients with atrial fibrillation.
Representative photomicrographs are shown for sections from atrial appendage samples from control hearts (left panels) or from patients with paroxysmal (PAF, center panels) or chronic (CAF, right panels) atrial fibrillation that were studied by double label immunofluorescence for Cx43 (green, top row) and Cx40 (red, second row). The third row shows the overlay between Cx43 and Cx40; spots containing both connexins are shown in white, while those containing only Cx43 are green and those containing only Cx40 are red. While the abundance of Cx43 appears similar in all three samples, Cx40 is diminished in PAF and severely reduced in CAF. This results in fewer white spots and many “green only” spots in the overlay images for PAF and CAF. The bottom panels show cytofluorogram scatter plots of the intensities of all pixels; Cx43 and Cx40 intensities are quantified according to a 0 – 255 gray scale. The yellow line shows the theoretical predicted mean for a perfect overlap of the distribution and intensities of Cx40 and Cx43. The red lines show the determined distributions, and illustrate the shift towards Cx43 predominance in the atrial fibrillation samples and the selective loss of Cx40. Bar, 42 μm.

