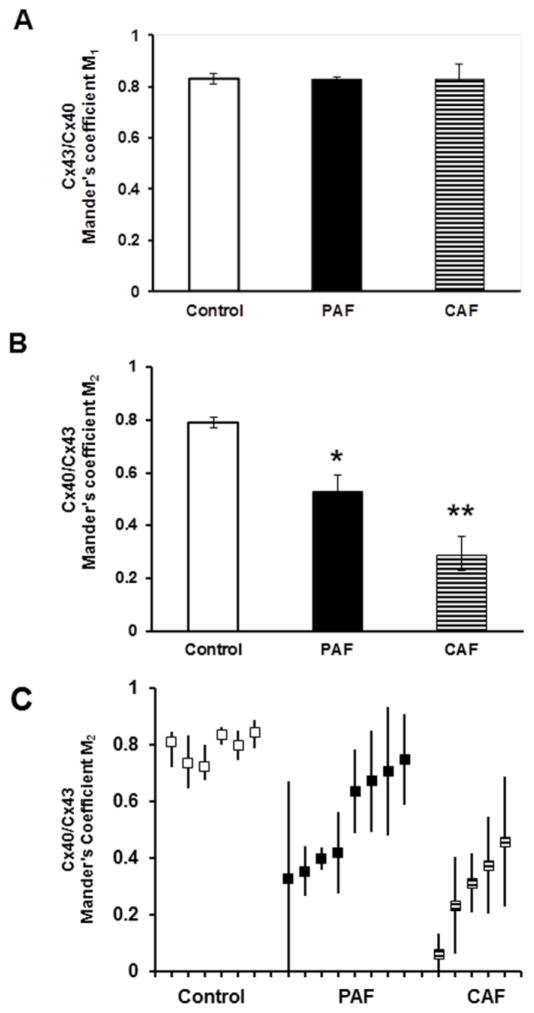
Figure 3. Co-localization coefficients show that Cx40 was reduced relative to Cx43 in atria of patients with atrial fibrillation.
The distribution of Cx43 and Cx40 and their overlap were determined by immunofluorescence (as illustrated in Fig. 2) for multiple sections from each control and diseased sample. For each section the overlap was quantified by calculating the Mander’s coefficients as described in Methods. A coefficient of 1.0 indicates perfect overlap while a coefficient of 0 indicates no overlap. Variables were defined so that Mander’s coefficient M1 is an expression of the overlap of Cx40 on Cx43 (Cx40 spots that also contain Cx43) and Mander’s coefficient M2 is an expression of the overlap of Cx43 on Cx40 (Cx43 spots that also contain Cx40). (A. B) The graphs show the Mander’s M1 (A) and M2 (B) coefficients (mean ± SEM) for groups of control (n = 6), PAF (n = 8), and CAF (n = 5) samples. Mean M1 values did not show any differences between control and diseased specimens. However, mean M2 values were reduced in PAF samples as compared to controls (*, p < 0.05, ANOVA) and reduced in CAF samples as compared to either controls or PAF samples (**, p < 0.05, ANOVA). These data quantify the selective loss of Cx40 from gap junctions in the atria of patients with paroxysmal and chronic atrial fibrillation. (C) The graph shows the mean M2 coefficient (solid squares) for each control, PAF or CAF sample analyzed. The bars represent the range of different M2 values determined from images of different sections in the same individual. Thus, there was a wide variation between AF patients (especially those with PAF) and within many individual AF patients.

