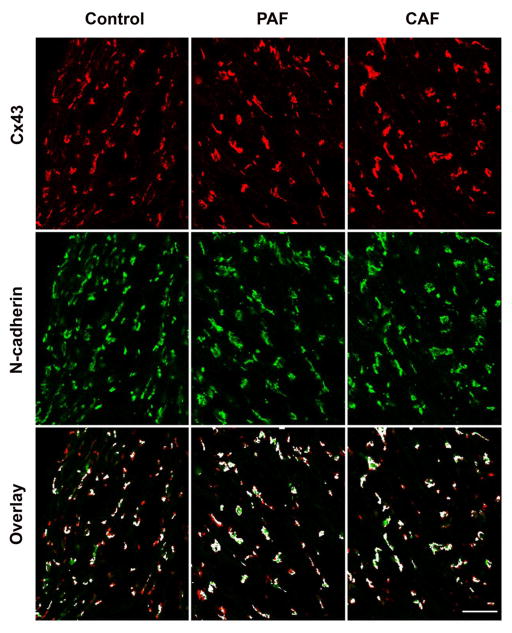
Figure 4. Immunolocalization of Cx43 vs. N-cadherin does not differ between control and AF patients.
Representative photomicrographs are shown for sections from atrial appendage samples from control hearts (left panels) or from patients with paroxysmal (PAF, center panels) or chronic (CAF, right panels) atrial fibrillation that were studied by double label immunofluorescence for Cx43 (red, top row) and N-cadherin (green, second row). The third row shows the overlay between Cx43 and N-cadherin; spots containing both proteins are shown in white, while those containing only Cx43 are red and those containing only N-cadherin are green. The abundance of Cx43 and N-cadherin appears similar in all three samples. Bar, 40 μm.

