
Fig. 4.
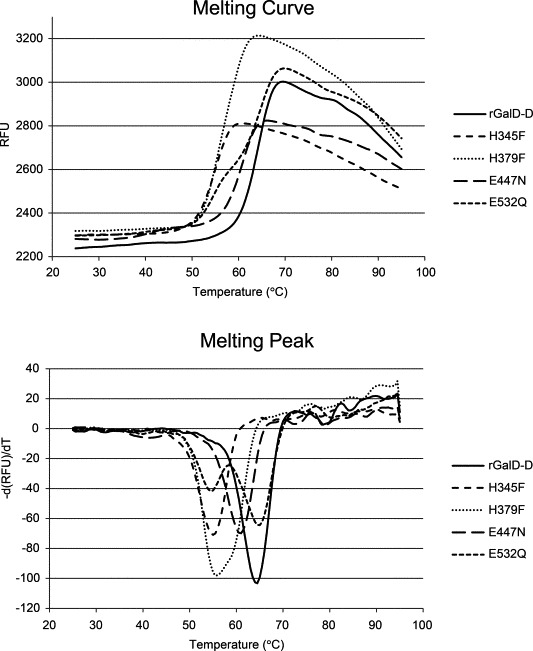
(Top) Melting curves showing protein unfolding by increasing temperatures, accompanied by increase in SYPRO Orange fluorescence. The melting temperature (Tm) values were determined by calculating the first derivative from the melting curve with CFX manager 2.0 software (Bio-Rad). (Bottom) The X-axis value (T) that corresponds with the lowest Y-axis value (−d(RFU)/dT) in the resulting curve resembles Tm. In the case of E532Q two melting temperatures were found.