
Fig. 3.
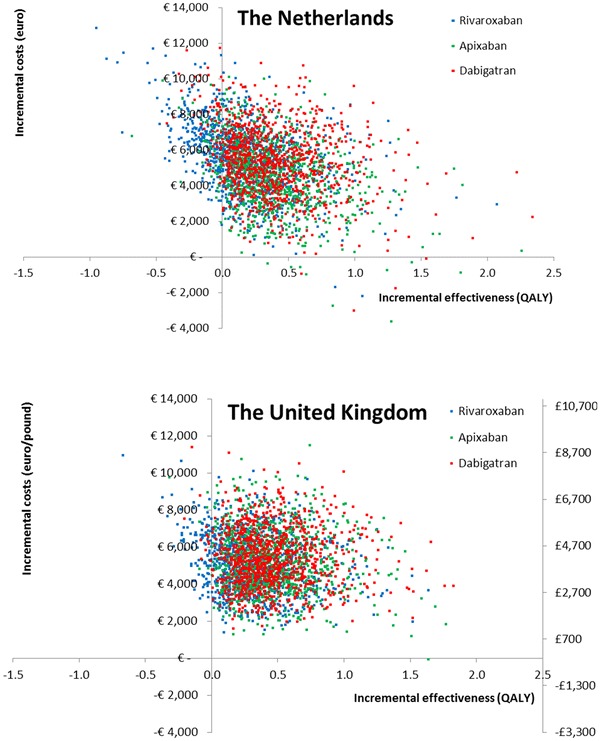
Scatter plots reflecting the uncertainty in the differences in costs and effectiveness between the new oral anticoagulants and coumarins (based on probabilistic sensitivity analysis). QALY quality-adjusted life-year
Official websites use .gov
A
.gov website belongs to an official
government organization in the United States.
Secure .gov websites use HTTPS
A lock (
) or https:// means you've safely
connected to the .gov website. Share sensitive
information only on official, secure websites.
Scatter plots reflecting the uncertainty in the differences in costs and effectiveness between the new oral anticoagulants and coumarins (based on probabilistic sensitivity analysis). QALY quality-adjusted life-year