
Figure 1.
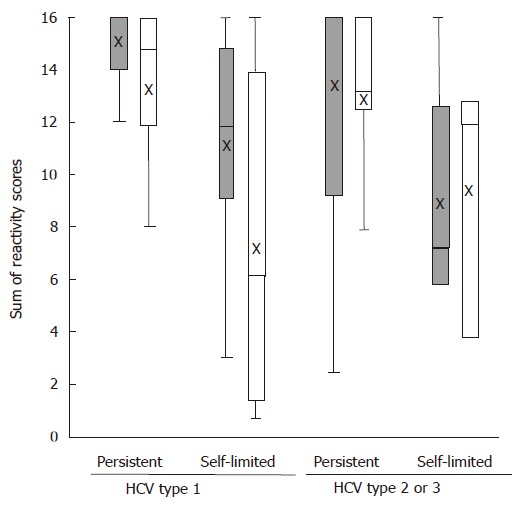
Serological reactivity to HCV encoded proteins with respect to virus type, the putative source and the outcome of infection. Grey indicates iv drug use and white indicates iv non-use. Mean values are indicated by x, medians by -, boxes show the interquartil range (central 50% of observations) and whiskers show the largest and lowest observed value (if not identified as outlier). By applying a regression model, an overall lower reactivity in patients with self-limited infection could be confirmed (P = 0.0012). Quantitative reactivity appears not to be affected by the outcome or the source of infection in patients with HCV types 2 or 3 (P = 0.9512).