
Figure 1.
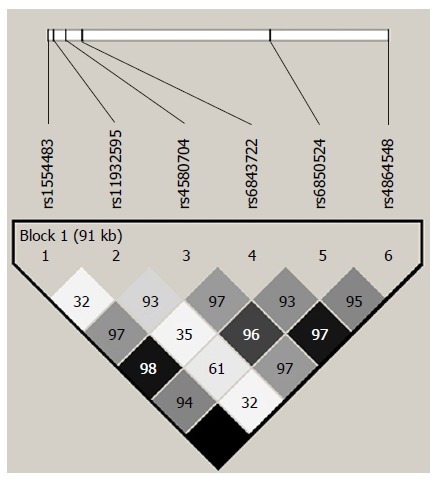
Linkage disequilibrium plot across the CLOCK gene. The horizontal white line depicts the 117-kb DNA segment of chromosome 4q12 analyzed in our sample. The 6 tagSNPs locations are indicated by hatch marks. A linkage disequilibrium plot is depicted in the bottom part of the figure. Each diamond represents the magnitude of LD for a single pair of markers, with colors indicating strong LD (black, r2 = 1.0) and no LD (white, r2 = 0) as the extremes (different gray tones indicate intermediate LD). Numbers inside the diamonds stand for D’ values.