
Figure 2.
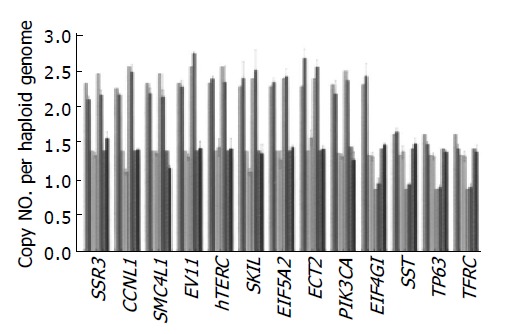
Comparison of copy numbers assessed by FISH (stripped bar) and Q-PCR (±SD) (hollow bar) of 13 genes in 4 EC-SCC cell lines [CE 48T/VGH (pink), CE 81T/VGH (yellow), TE6 (green), TE9 (blue)]. Pearson coefficients of correlation for comparing FISH and Q-PCR of 13 genes in 4 cell lines were all >0.9.