Figure 1.

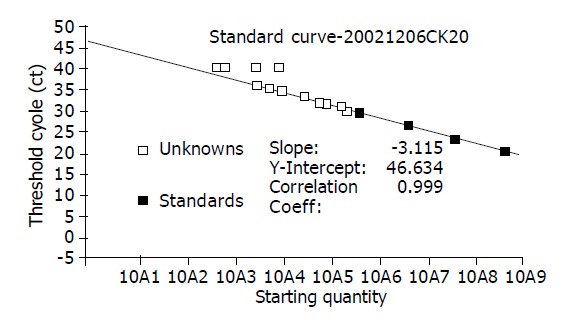
CK20mRNA Standard Curve: 3 until 15 cycles were the baseline and its standard deviation was calculated. Ct (threshold cycle) values were calculated by determining the point at which the fluorescence exceeded a threshold limit.

CK20mRNA Standard Curve: 3 until 15 cycles were the baseline and its standard deviation was calculated. Ct (threshold cycle) values were calculated by determining the point at which the fluorescence exceeded a threshold limit.