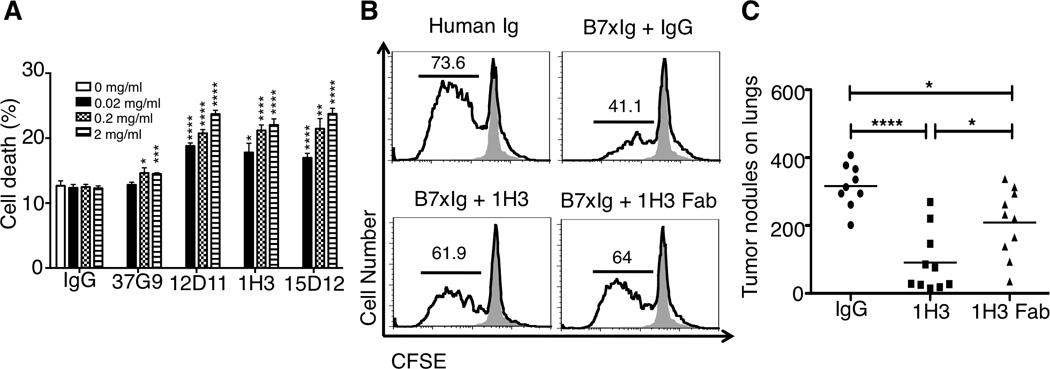
Figure 5. Anti-tumor Mechanisms of 1H3 Treatment.

(A) mAbs against B7x killed CT26 tumor cells expressing B7x through antibody-dependent cellular cytotoxicity in vitro. Data are representative of two independent experiments in triplicates and shown as mean ± SE. **p<0.01; ****p<0.0001. (B) 1H3 partially neutralized B7x-mediated T cell coinhibition. CFSE-labeled T cells were incubated for four days with plate-bound anti-CD3 in the presence of control Ig, B7x-Ig and IgG (2 µg/ml), B7x-Ig and 1H3 (2 µg/ml), or B7x-Ig and 1H3 Fab (4 µg/ml). Representative FACS plots show CFSE dilution among live stimulated cells (solid line) compared to unstimulated control T cells (shaded area). Data are representative of two independent experiments. (C) Comparison of therapeutic efficacies between 1H3 and its Fab. Data were pooled from two independent experiments (n=9 or 10). *p<0.05; **p<0.01, ***p<0.001, ****p<0.0001.
