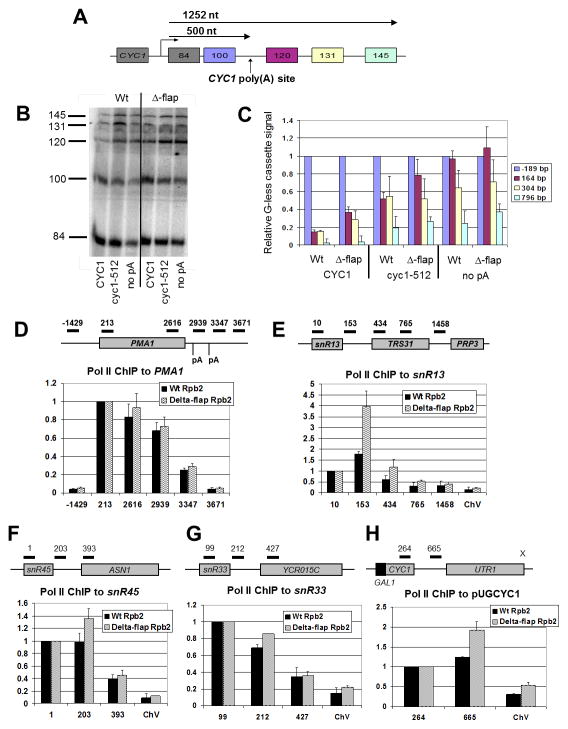
Figure 2. Δ-flap Pol II accumulates in the intergenic region downstream of short genes.
(A) Tandem G-less cassette transcription template. The transcription start site, the position and lengths of the G-less cassettes, the position of the inserted CYC1 poly(A) element, and the distance in nucleotides (nt) to the poly(A) site and the end of the last cassette are indicated.
(B) Radio-labeled G-less cassette transcription fragments synthesized in Wt and Δ-flap extracts are shown resolved on a 6% polyacrylamide/7M urea gel. The three transcription templates contain the complete CYC1 poly(A) signal (CYC1), a mutated poly(A) signal in which the positioning and efficiency elements have been removed (cyc1-512), or no poly(A) elements (no pA). Lengths, in bases, of the G-less cassettes produced upon T1 RNase digestion of transcript are indicated.
(C) Quantification of transcription products in (B). Bars are shaded to correspond to the G-less cassettes shown in (A). G-less cassettes downstream of the CYC1 poly(A) signal are normalized to the 100 nt G-less cassette. Error bars represent the standard deviation from the average values generated from three independent experiments.
(D–H) Relative Pol II occupancy in Wt (black) and Δ-flap (wavy lines) Pol II strains at indicated PMA1, snR13, snR45, snR33 and CYC1 (pUGCYC1) positions, respectively. Schematics of the qPCR primer sets used to measure occupancy are included. The promoter of the convergent UTR1 gene on pUGCYC1 has been inactivated (indicated by an X). Pol II ChIP signals were obtained with the 4H8 antibody, which recognizes both phosphorylated and unphosphorylated Ser residues on the CTD. The signal at position −1429 is taken as background signal at PMA1, and the signal at ChV intergenic region is taken as background signal at the snoRNA and CYC1 genes. Error bars represent the standard error and the standard deviation, respectively, calculated from either two or three independent biological replicates from cells shifted to 37°C for 30 min., with each qPCR experiment performed in duplicate.

