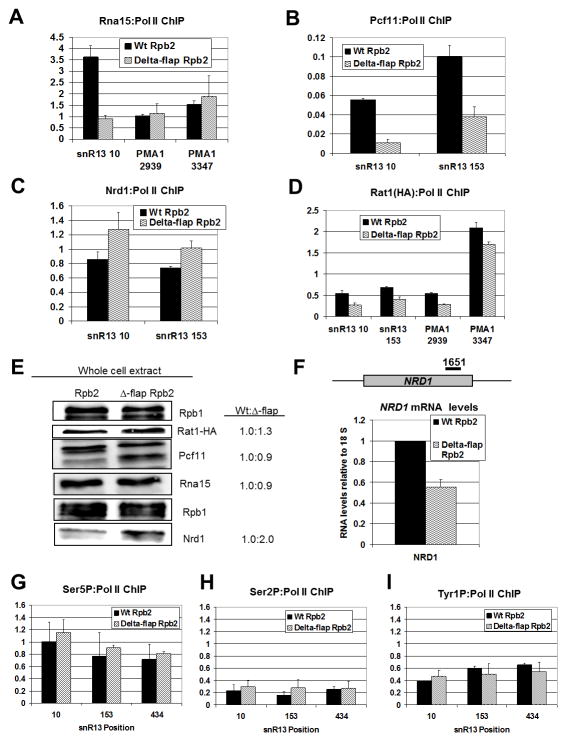
Figure 3. Flap loop removal alters Pol II occupancy and termination factor recruitment on snoRNA genes.
(A–D) ChIP signals of Rna15, Pcf11, Nrd1 and Rat1-HA normalized to Pol II occupancy are displayed, respectively, as a percentage of input for Wt (black) and Δ-flap (wavy lines) strains at the indicated PMA1 and snR13 positions. ChIP for Rna15, Pcf11 and Nrd1 was performed with antibodies against these proteins. An HA antibody was used for Rat1 ChIP. Error bars represent the standard error calculated from two independent biological replicates from cells shifted to 37°C for 30 min., with each qPCR experiment performed in duplicate.
(E) Western blot of Rpb1, Rat1, Pcf11, Nrd1 and Rna15 in Wt and Δ-flap extracts is shown with quantified Wt-to-mutant ratios of normalized protein abundance (right). The relative level of protein in the Wt strain is set to 1.0 and normalization is to Rpb1. Normalization to beta-actin gives similar values (data not shown).
(F) Full-length NRD1 transcript levels in Wt (black) and D-flap (wavy lines) strains as measured by RT-qPCR. The position of the qPCR primer set is shown. All qPCR signals were normalized to the ribosomal 18S qPCR signal, and the relative amount of NRD1 RNA in the Wt strain was set to 1. Error bars represent the standard deviation calculated from three independent biological replicates from cells shifted to 37°C for 30 min., with each qPCR experiment performed in duplicate.
(G–I) ChIP signals of Ser5P, Ser2P and Tyr1P normalized to total Pol II occupancy are displayed, respectively, presented as a percentage of input for Wt (black) and Δ-flap (wavy lines) strains at the indicated snR13 positions. ChIP for Ser5P, Ser2P and Tyr1P was performed with 3E8, H5 and 3D12 antibodies, respectively. Error bars represent the standard error calculated from two independent biological replicates from cells shifted to 37°C for 30 min., with each qPCR experiment performed in duplicate.

